

470
Chemical Oceanography, 4th Edition
photosynthesis in the surface water and sinks into the deep- water column. A shallower
oxic–anoxic interface is found during the upwelling season because of the high productivity in the surface water.
The concentrations of ammonia, phosphate, and silicate in the eastern basin are shown
in Figure 10.58. In surface waters, about 1 μM of ammonia was present in the euphotic
zone at 30 m and was undetectable below 60 m. The ammonia increases rapidly below the
oxic–anoxic interface to 20.2 μM at 1300 m. The concentrations of phosphate in the surface
waters are below 0.4 μM, increase rapidly with depth to 2.3 μM at the oxic–anoxic interface,
and reach a value of 3.7 μM at 1300 m. The concentrations of silicate in the surface waters
are less than 2 μM, increase rapidly with depth to about 42 μM at the oxic–anoxic interface, and reach values of 86 μM at 1300 m. The sampling across the interface was not close
enough to see the detailed changes in NO 3
– and PO 4
3– as seen in the Black Sea.
The profiles of sulfite and thiosulfate are presented in Figure 10.59. The levels of sulfite
and thiosulfate were undetectable in the oxic waters but were found in micromolar levels
in the deep waters (1.8 μM at about 600 m for sulfite and 1.0 μM for thiosulfate). The sulfite
and thiosulfate may be caused by the oxidation of H 2 S from oxygenated waters that periodically sink below the oxic–anoxic interface. The tritium measurements made by Goto
Ostlund (University of Miami, personal communication) on waters collected at the same
time support the idea that the deep waters had been renewed with detectable levels of
tritium found in the bottom waters. The work of Holmen and Rooth (1991) supports the
episodic injection of water into the mid- depth of the waters in the trench. The thiosulfate
increases gradually as one approaches the bottom and shows no maximum near 600 m.
The higher values in the deep waters suggest a sediment source for the thiosulfate. A
Temperature (°C)
15
20
25
30
Depth (m)
0
200
400
600
800
1000
1200
1400
Salinity
35.2
35.6
36.0
36.4
36.8
Temp.
Salinity
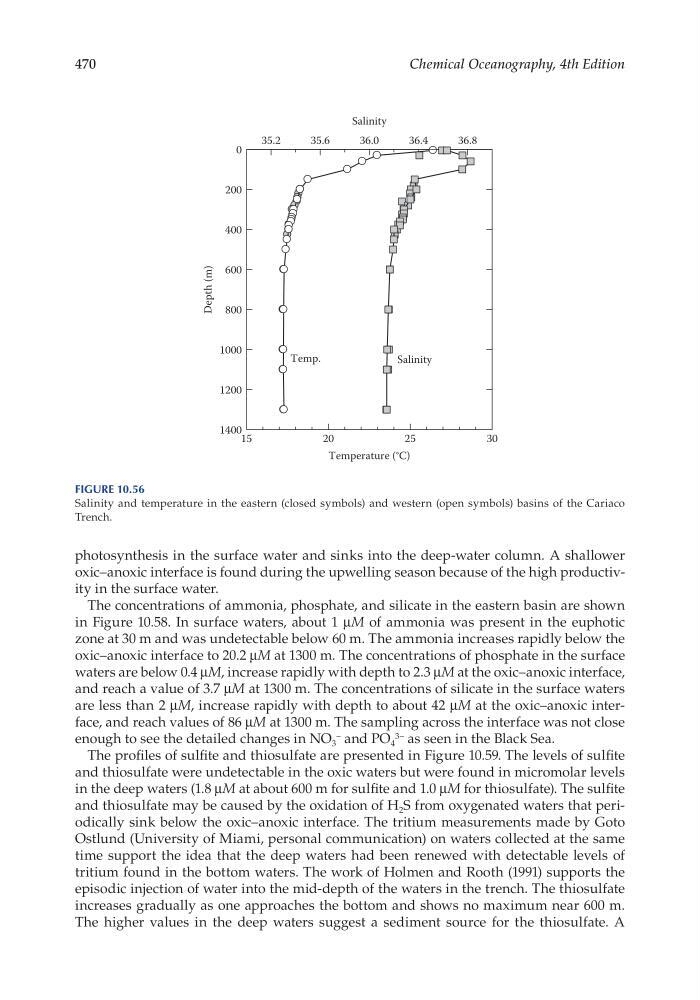
Figure 10.56
Salinity and temperature in the eastern (closed symbols) and western (open symbols) basins of the Cariaco
Trench.
Chemical Oceanography, 4th Edition
photosynthesis in the surface water and sinks into the deep- water column. A shallower
oxic–anoxic interface is found during the upwelling season because of the high productivity in the surface water.
The concentrations of ammonia, phosphate, and silicate in the eastern basin are shown
in Figure 10.58. In surface waters, about 1 μM of ammonia was present in the euphotic
zone at 30 m and was undetectable below 60 m. The ammonia increases rapidly below the
oxic–anoxic interface to 20.2 μM at 1300 m. The concentrations of phosphate in the surface
waters are below 0.4 μM, increase rapidly with depth to 2.3 μM at the oxic–anoxic interface,
and reach a value of 3.7 μM at 1300 m. The concentrations of silicate in the surface waters
are less than 2 μM, increase rapidly with depth to about 42 μM at the oxic–anoxic interface, and reach values of 86 μM at 1300 m. The sampling across the interface was not close
enough to see the detailed changes in NO 3
– and PO 4
3– as seen in the Black Sea.
The profiles of sulfite and thiosulfate are presented in Figure 10.59. The levels of sulfite
and thiosulfate were undetectable in the oxic waters but were found in micromolar levels
in the deep waters (1.8 μM at about 600 m for sulfite and 1.0 μM for thiosulfate). The sulfite
and thiosulfate may be caused by the oxidation of H 2 S from oxygenated waters that periodically sink below the oxic–anoxic interface. The tritium measurements made by Goto
Ostlund (University of Miami, personal communication) on waters collected at the same
time support the idea that the deep waters had been renewed with detectable levels of
tritium found in the bottom waters. The work of Holmen and Rooth (1991) supports the
episodic injection of water into the mid- depth of the waters in the trench. The thiosulfate
increases gradually as one approaches the bottom and shows no maximum near 600 m.
The higher values in the deep waters suggest a sediment source for the thiosulfate. A
Temperature (°C)
15
20
25
30
Depth (m)
0
200
400
600
800
1000
1200
1400
Salinity
35.2
35.6
36.0
36.4
36.8
Temp.
Salinity
Figure 10.56
Salinity and temperature in the eastern (closed symbols) and western (open symbols) basins of the Cariaco
Trench.