

468
Chemical Oceanography, 4th Edition
Profiles of oxygen and hydrogen sulfide are shown in Figure 10.57 for the two basins.
The maximum oxygen occurred at the surface in both basins (211 μM in the western basin
and 208 μM in the eastern basin). The oxygen concentrations decreased sharply with depth
and became undetectable at 330 m, where hydrogen sulfide appeared in both basins. The
concentrations of hydrogen sulfide increased rapidly below the interface to maximum values of 58 μM in the eastern basin and 55 μM in the western basin at 1300 m.
The depth of the oxic–anoxic interface in the Cariaco Trench has fluctuated between
250 to 375 m since the first expedition in 1956 (Table 10.9). The depth of the interface is
controlled by changes in the density or the flux of organic matter, which is produced by
0
50 100 150 200 250 300 350 400 450
NH 4 (µmol kg
–1 )
0 10 20 30 40 50 60 70 80 90 100 110
σ
T
12
13
14
15
16
17
σ
T
12
13
14
15
16
17
σ
T
12
13
14
15
16
17
σ
T
12
13
14
15
16
17
σ
T
12
13
14
15
16
17
σ
T
12
13
14
15
16
17
0
1
2
3
4
5
6
7
8
9
0
50
100
150
200
250
300
350
NO 3 (µmol kg
–1 )
PO 4 (µmol kg
–1 )
H 2 S (µmol kg
–1 )
Si(OH) 4 (µmol kg
–1 )
0
2
4
6
8
10
12
14
TA (µmol kg
–1 )
3200 3400 3600 3800 4000 4200 4400
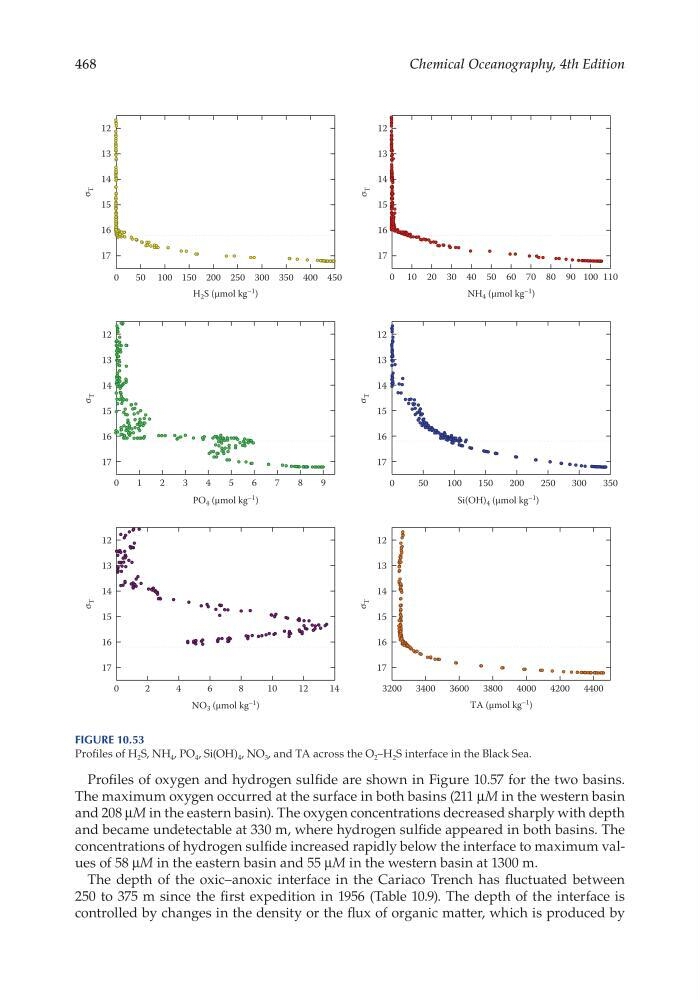
Figure 10.53
Profiles of H 2 S, NH 4 , PO 4 , Si(OH) 4 , NO 3 , and TA across the O 2 –H 2 S interface in the Black Sea.
Chemical Oceanography, 4th Edition
Profiles of oxygen and hydrogen sulfide are shown in Figure 10.57 for the two basins.
The maximum oxygen occurred at the surface in both basins (211 μM in the western basin
and 208 μM in the eastern basin). The oxygen concentrations decreased sharply with depth
and became undetectable at 330 m, where hydrogen sulfide appeared in both basins. The
concentrations of hydrogen sulfide increased rapidly below the interface to maximum values of 58 μM in the eastern basin and 55 μM in the western basin at 1300 m.
The depth of the oxic–anoxic interface in the Cariaco Trench has fluctuated between
250 to 375 m since the first expedition in 1956 (Table 10.9). The depth of the interface is
controlled by changes in the density or the flux of organic matter, which is produced by
0
50 100 150 200 250 300 350 400 450
NH 4 (µmol kg
–1 )
0 10 20 30 40 50 60 70 80 90 100 110
σ
T
12
13
14
15
16
17
σ
T
12
13
14
15
16
17
σ
T
12
13
14
15
16
17
σ
T
12
13
14
15
16
17
σ
T
12
13
14
15
16
17
σ
T
12
13
14
15
16
17
0
1
2
3
4
5
6
7
8
9
0
50
100
150
200
250
300
350
NO 3 (µmol kg
–1 )
PO 4 (µmol kg
–1 )
H 2 S (µmol kg
–1 )
Si(OH) 4 (µmol kg
–1 )
0
2
4
6
8
10
12
14
TA (µmol kg
–1 )
3200 3400 3600 3800 4000 4200 4400
Figure 10.53
Profiles of H 2 S, NH 4 , PO 4 , Si(OH) 4 , NO 3 , and TA across the O 2 –H 2 S interface in the Black Sea.