

465
Processes in the Oceans
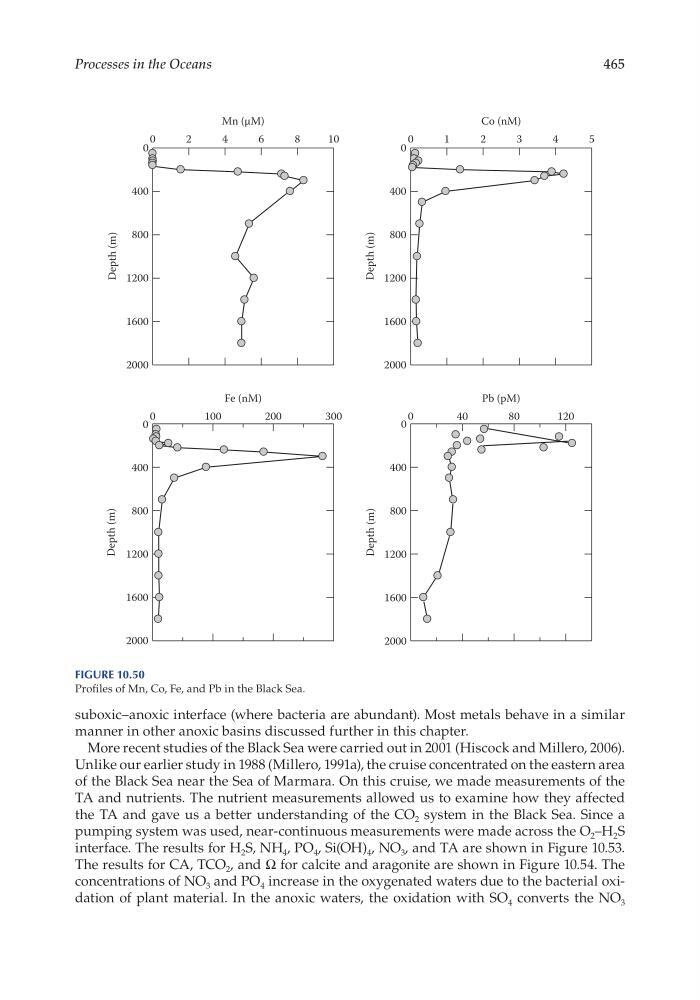
suboxic–anoxic interface (where bacteria are abundant). Most metals behave in a similar
manner in other anoxic basins discussed further in this chapter.
More recent studies of the Black Sea were carried out in 2001 (Hiscock and Millero, 2006).
Unlike our earlier study in 1988 (Millero, 1991a), the cruise concentrated on the eastern area
of the Black Sea near the Sea of Marmara. On this cruise, we made measurements of the
TA and nutrients. The nutrient measurements allowed us to examine how they affected
the TA and gave us a better understanding of the CO 2 system in the Black Sea. Since a
pumping system was used, near- continuous measurements were made across the O 2 –H 2 S
interface. The results for H 2 S, NH 4 , PO 4 , Si(OH) 4 , NO 3 , and TA are shown in Figure 10.53.
The results for CA, TCO 2 , and Ω for calcite and aragonite are shown in Figure 10.54. The
concentrations of NO 3 and PO 4 increase in the oxygenated waters due to the bacterial oxidation of plant material. In the anoxic waters, the oxidation with SO 4 converts the NO 3
Mn (µM)
0
2
4
6
8
10
Co (nM)
0
1
2
3
4
5
Fe (nM)
0
100
200
300
Depth (m)
0
400
800
1200
1600
2000
Pb (pM)
0
40
80
120
Depth (m)
0
400
800
1200
1600
2000
Depth (m)
0
400
800
1200
1600
2000
Depth (m)
0
400
800
1200
1600
2000
Figure 10.50
Profiles of Mn, Co, Fe, and Pb in the Black Sea.
Processes in the Oceans
suboxic–anoxic interface (where bacteria are abundant). Most metals behave in a similar
manner in other anoxic basins discussed further in this chapter.
More recent studies of the Black Sea were carried out in 2001 (Hiscock and Millero, 2006).
Unlike our earlier study in 1988 (Millero, 1991a), the cruise concentrated on the eastern area
of the Black Sea near the Sea of Marmara. On this cruise, we made measurements of the
TA and nutrients. The nutrient measurements allowed us to examine how they affected
the TA and gave us a better understanding of the CO 2 system in the Black Sea. Since a
pumping system was used, near- continuous measurements were made across the O 2 –H 2 S
interface. The results for H 2 S, NH 4 , PO 4 , Si(OH) 4 , NO 3 , and TA are shown in Figure 10.53.
The results for CA, TCO 2 , and Ω for calcite and aragonite are shown in Figure 10.54. The
concentrations of NO 3 and PO 4 increase in the oxygenated waters due to the bacterial oxidation of plant material. In the anoxic waters, the oxidation with SO 4 converts the NO 3
Mn (µM)
0
2
4
6
8
10
Co (nM)
0
1
2
3
4
5
Fe (nM)
0
100
200
300
Depth (m)
0
400
800
1200
1600
2000
Pb (pM)
0
40
80
120
Depth (m)
0
400
800
1200
1600
2000
Depth (m)
0
400
800
1200
1600
2000
Depth (m)
0
400
800
1200
1600
2000
Figure 10.50
Profiles of Mn, Co, Fe, and Pb in the Black Sea.