

455
Processes in the Oceans
1400 m. The water is isohaline and isothermal from 600 m to the bottom. It is permanently
anoxic below a depth of 350 m. The appearance of H 2 S above the thermocline is caused by
mixing. Both basins have a physical obstacle that prevents horizontal mixing of various
water masses. In a fjord- type basin, a shallow sill prevents the salty seawater rich in O 2
from entering the basin and sinking to the bottom.
In recent years, estuarine systems with deep basins like the Baltic and Chesapeake have
experienced periodic anoxic behavior. The Mississippi plume also becomes nearly anoxic
at certain times of the year. This has been attributed to higher productivity in the surface
waters caused by increases of nutrients used as fertilizers and perhaps by acid rain. Some
examples of anoxic basins are given in Table 10.8.
The loss of oxygen in a basin or sediment pore waters causes a series of reactions to
occur in a given sequence that is shown in Figure 10.44. Biogeochemical cycles of C, N,
P, and S are linked because they are all involved in the photosynthesis and respiration
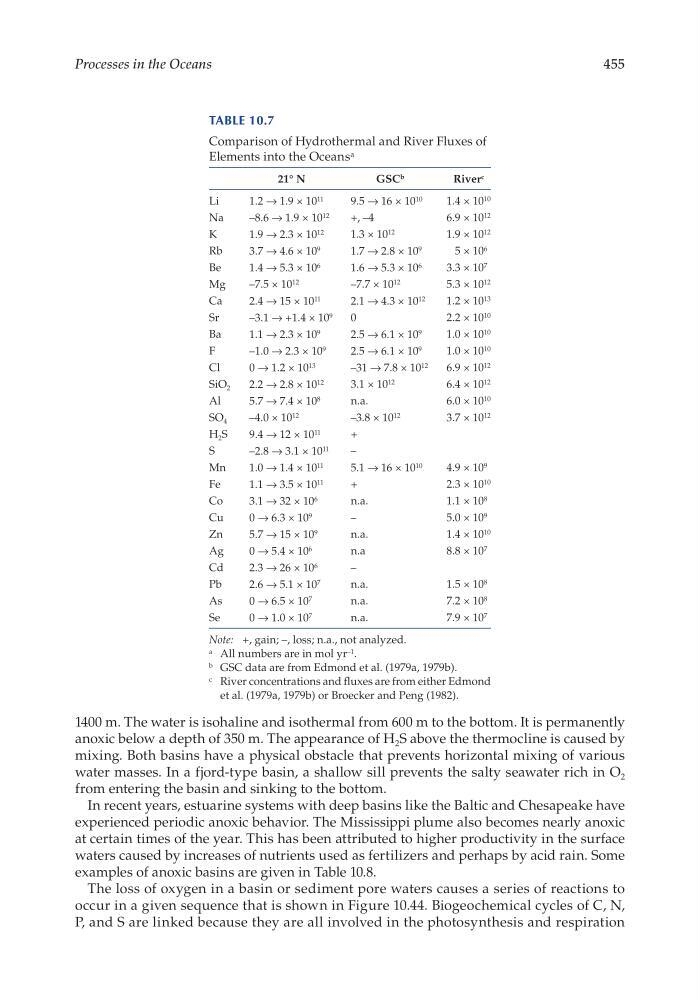
Table 10.7
Comparison of Hydrothermal and River Fluxes of
Elements into the Oceans a
21° N
GSC b
River c
Li
1.2 → 1.9 × 10 11
9.5 → 16 × 10 10
1.4 × 10 10
Na
–8.6 → 1.9 × 10 12
+, –4
6.9 × 10 12
K
1.9 → 2.3 × 10 12
1.3 × 10 12
1.9 × 10 12
Rb
3.7 → 4.6 × 10 9
1.7 → 2.8 × 10 9
5 × 10 6
Be
1.4 → 5.3 × 10 6
1.6 → 5.3 × 10 6
3.3 × 10 7
Mg
–7.5 × 10 12
–7.7 × 10 12
5.3 × 10 12
Ca
2.4 → 15 × 10 11
2.1 → 4.3 × 10 12
1.2 × 10 13
Sr
–3.1 → +1.4 × 10 9
0
2.2 × 10 10
Ba
1.1 → 2.3 × 10 9
2.5 → 6.1 × 10 9
1.0 × 10 10
F
–1.0 → 2.3 × 10 9
2.5 → 6.1 × 10 9
1.0 × 10 10
Cl
0 → 1.2 × 10 13
–31 → 7.8 × 10 12
6.9 × 10 12
SiO 2
2.2 → 2.8 × 10 12
3.1 × 10 12
6.4 × 10 12
Al
5.7 → 7.4 × 10 8
n.a.
6.0 × 10 10
SO 4
–4.0 × 10 12
–3.8 × 10 12
3.7 × 10 12
H 2 S
9.4 → 12 × 10 11
+
S
–2.8 → 3.1 × 10 11
–
Mn
1.0 → 1.4 × 10 11
5.1 → 16 × 10 10
4.9 × 10 9
Fe
1.1 → 3.5 × 10 11
+
2.3 × 10 10
Co
3.1 → 32 × 10 6
n.a.
1.1 × 10 8
Cu
0 → 6.3 × 10 9
–
5.0 × 10 9
Zn
5.7 → 15 × 10 9
n.a.
1.4 × 10 10
Ag
0 → 5.4 × 10 6
n.a
8.8 × 10 7
Cd
2.3 → 26 × 10 6
–
Pb
2.6 → 5.1 × 10 7
n.a.
1.5 × 10 8
As
0 → 6.5 × 10 7
n.a.
7.2 × 10 8
Se
0 → 1.0 × 10 7
n.a.
7.9 × 10 7
Note: +, gain; –, loss; n.a., not analyzed.
a All numbers are in mol yr –1 .
b GSC data are from Edmond et al. (1979a, 1979b).
c River concentrations and fluxes are from either Edmond
et al. (1979a, 1979b) or Broecker and Peng (1982).
Processes in the Oceans
1400 m. The water is isohaline and isothermal from 600 m to the bottom. It is permanently
anoxic below a depth of 350 m. The appearance of H 2 S above the thermocline is caused by
mixing. Both basins have a physical obstacle that prevents horizontal mixing of various
water masses. In a fjord- type basin, a shallow sill prevents the salty seawater rich in O 2
from entering the basin and sinking to the bottom.
In recent years, estuarine systems with deep basins like the Baltic and Chesapeake have
experienced periodic anoxic behavior. The Mississippi plume also becomes nearly anoxic
at certain times of the year. This has been attributed to higher productivity in the surface
waters caused by increases of nutrients used as fertilizers and perhaps by acid rain. Some
examples of anoxic basins are given in Table 10.8.
The loss of oxygen in a basin or sediment pore waters causes a series of reactions to
occur in a given sequence that is shown in Figure 10.44. Biogeochemical cycles of C, N,
P, and S are linked because they are all involved in the photosynthesis and respiration
Table 10.7
Comparison of Hydrothermal and River Fluxes of
Elements into the Oceans a
21° N
GSC b
River c
Li
1.2 → 1.9 × 10 11
9.5 → 16 × 10 10
1.4 × 10 10
Na
–8.6 → 1.9 × 10 12
+, –4
6.9 × 10 12
K
1.9 → 2.3 × 10 12
1.3 × 10 12
1.9 × 10 12
Rb
3.7 → 4.6 × 10 9
1.7 → 2.8 × 10 9
5 × 10 6
Be
1.4 → 5.3 × 10 6
1.6 → 5.3 × 10 6
3.3 × 10 7
Mg
–7.5 × 10 12
–7.7 × 10 12
5.3 × 10 12
Ca
2.4 → 15 × 10 11
2.1 → 4.3 × 10 12
1.2 × 10 13
Sr
–3.1 → +1.4 × 10 9
0
2.2 × 10 10
Ba
1.1 → 2.3 × 10 9
2.5 → 6.1 × 10 9
1.0 × 10 10
F
–1.0 → 2.3 × 10 9
2.5 → 6.1 × 10 9
1.0 × 10 10
Cl
0 → 1.2 × 10 13
–31 → 7.8 × 10 12
6.9 × 10 12
SiO 2
2.2 → 2.8 × 10 12
3.1 × 10 12
6.4 × 10 12
Al
5.7 → 7.4 × 10 8
n.a.
6.0 × 10 10
SO 4
–4.0 × 10 12
–3.8 × 10 12
3.7 × 10 12
H 2 S
9.4 → 12 × 10 11
+
S
–2.8 → 3.1 × 10 11
–
Mn
1.0 → 1.4 × 10 11
5.1 → 16 × 10 10
4.9 × 10 9
Fe
1.1 → 3.5 × 10 11
+
2.3 × 10 10
Co
3.1 → 32 × 10 6
n.a.
1.1 × 10 8
Cu
0 → 6.3 × 10 9
–
5.0 × 10 9
Zn
5.7 → 15 × 10 9
n.a.
1.4 × 10 10
Ag
0 → 5.4 × 10 6
n.a
8.8 × 10 7
Cd
2.3 → 26 × 10 6
–
Pb
2.6 → 5.1 × 10 7
n.a.
1.5 × 10 8
As
0 → 6.5 × 10 7
n.a.
7.2 × 10 8
Se
0 → 1.0 × 10 7
n.a.
7.9 × 10 7
Note: +, gain; –, loss; n.a., not analyzed.
a All numbers are in mol yr –1 .
b GSC data are from Edmond et al. (1979a, 1979b).
c River concentrations and fluxes are from either Edmond
et al. (1979a, 1979b) or Broecker and Peng (1982).