

401
Primary Production in the Oceans
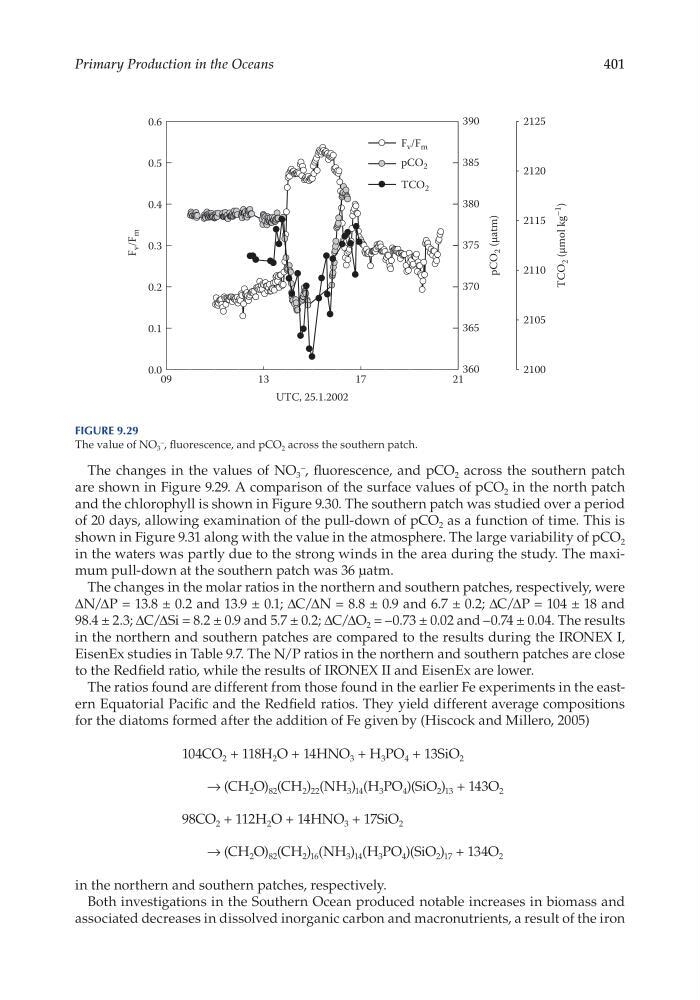
The changes in the values of NO 3
– , fluorescence, and pCO 2 across the southern patch
are shown in Figure 9.29. A comparison of the surface values of pCO 2 in the north patch
and the chlorophyll is shown in Figure 9.30. The southern patch was studied over a period
of 20 days, allowing examination of the pull- down of pCO 2 as a function of time. This is
shown in Figure 9.31 along with the value in the atmosphere. The large variability of pCO 2
in the waters was partly due to the strong winds in the area during the study. The maximum pull- down at the southern patch was 36 μatm.
The changes in the molar ratios in the northern and southern patches, respectively, were
ΔN/ ΔP = 13.8 ± 0.2 and 13.9 ± 0.1; ΔC/ ΔN = 8.8 ± 0.9 and 6.7 ± 0.2; ΔC/ ΔP = 104 ± 18 and
98.4 ± 2.3; ΔC/ ΔSi = 8.2 ± 0.9 and 5.7 ± 0.2; ΔC/ ΔO 2 = –0.73 ± 0.02 and –0.74 ± 0.04. The results
in the northern and southern patches are compared to the results during the IRONEX I,
EisenEx studies in Table 9.7. The N/ P ratios in the northern and southern patches are close
to the Redfield ratio, while the results of IRONEX II and EisenEx are lower.
The ratios found are different from those found in the earlier Fe experiments in the eastern Equatorial Pacific and the Redfield ratios. They yield different average compositions
for the diatoms formed after the addition of Fe given by (Hiscock and Millero, 2005)
104CO 2 + 118H 2 O + 14HNO 3 + H 3 PO 4 + 13SiO 2
→ (CH 2 O) 82 (CH 2 ) 22 (NH 3 ) 14 (H 3 PO 4 )(SiO 2 ) 13 + 143O 2
98CO 2 + 112H 2 O + 14HNO 3 + 17SiO 2
→ (CH 2 O) 82 (CH 2 ) 16 (NH 3 ) 14 (H 3 PO 4 )(SiO 2 ) 17 + 134O 2
in the northern and southern patches, respectively.
Both investigations in the Southern Ocean produced notable increases in biomass and
associated decreases in dissolved inorganic carbon and macronutrients, a result of the iron
UTC, 25.1.2002
09
13
17
21
F
v /F
m
0.0
0.1
0.2
0.3
0.4
0.5
0.6
pCO
2 (µatm)
360
365
370
375
380
385
390
TCO
2 (µmol kg
–1
)
2100
2105
2110
2115
2120
2125
F v /F m
pCO 2
TCO 2
Figure 9.29
The value of NO 3
– , fluorescence, and pCO 2 across the southern patch.
Primary Production in the Oceans
The changes in the values of NO 3
– , fluorescence, and pCO 2 across the southern patch
are shown in Figure 9.29. A comparison of the surface values of pCO 2 in the north patch
and the chlorophyll is shown in Figure 9.30. The southern patch was studied over a period
of 20 days, allowing examination of the pull- down of pCO 2 as a function of time. This is
shown in Figure 9.31 along with the value in the atmosphere. The large variability of pCO 2
in the waters was partly due to the strong winds in the area during the study. The maximum pull- down at the southern patch was 36 μatm.
The changes in the molar ratios in the northern and southern patches, respectively, were
ΔN/ ΔP = 13.8 ± 0.2 and 13.9 ± 0.1; ΔC/ ΔN = 8.8 ± 0.9 and 6.7 ± 0.2; ΔC/ ΔP = 104 ± 18 and
98.4 ± 2.3; ΔC/ ΔSi = 8.2 ± 0.9 and 5.7 ± 0.2; ΔC/ ΔO 2 = –0.73 ± 0.02 and –0.74 ± 0.04. The results
in the northern and southern patches are compared to the results during the IRONEX I,
EisenEx studies in Table 9.7. The N/ P ratios in the northern and southern patches are close
to the Redfield ratio, while the results of IRONEX II and EisenEx are lower.
The ratios found are different from those found in the earlier Fe experiments in the eastern Equatorial Pacific and the Redfield ratios. They yield different average compositions
for the diatoms formed after the addition of Fe given by (Hiscock and Millero, 2005)
104CO 2 + 118H 2 O + 14HNO 3 + H 3 PO 4 + 13SiO 2
→ (CH 2 O) 82 (CH 2 ) 22 (NH 3 ) 14 (H 3 PO 4 )(SiO 2 ) 13 + 143O 2
98CO 2 + 112H 2 O + 14HNO 3 + 17SiO 2
→ (CH 2 O) 82 (CH 2 ) 16 (NH 3 ) 14 (H 3 PO 4 )(SiO 2 ) 17 + 134O 2
in the northern and southern patches, respectively.
Both investigations in the Southern Ocean produced notable increases in biomass and
associated decreases in dissolved inorganic carbon and macronutrients, a result of the iron
UTC, 25.1.2002
09
13
17
21
F
v /F
m
0.0
0.1
0.2
0.3
0.4
0.5
0.6
pCO
2 (µatm)
360
365
370
375
380
385
390
TCO
2 (µmol kg
–1
)
2100
2105
2110
2115
2120
2125
F v /F m
pCO 2
TCO 2
Figure 9.29
The value of NO 3
– , fluorescence, and pCO 2 across the southern patch.