

397
Primary Production in the Oceans
9.2.3 irONeX ii Study
Although the results of the IRONEX I experiment were encouraging, many questions
remained. It was not clear that the modest increase in productivity and negligible loss of
nitrogen and phosphate resulted from the loss of Fe or an increase in zooplankton grazing. In May 1995, the IRONEX II study was conducted in Equatorial Pacific to attempt
to answer some of these questions. During this experiment, the patch was repeatedly
fertilized with Fe and studied for 19 days. The response of the system to an initial 2-nM
iron infusion and two subsequent 1-nM reinfusions to the surface water were measured
several times a day during the study. The results led to a significant decrease in nutrients and carbon dioxide (Coale et al., 1996). A summary of the decreases in the nutrients
and carbon dioxide parameters during the IRONEX II study is given in Table 9.5. The
decreases in NO 3
– , PO 4
3– , Si(OH) 4 , TCO 2 (total carbon dioxide), and pCO 2 were much larger
in the IRONEX II study. The maximum changes of the carbonate parameters within the
patch relative to outside measurements were –27 μmol kg –1 in TCO 2 , –73 μatm in pCO 2 ,
and +0.058 in pH on days 8 and 9 of the experiment. The total alkalinity (TA) did not
change within the experimental error of the measurements (±3 μmol kg –1 ). In addition to
the daily measurements, three transects were made across the patch that showed a spatial
biochemical response to the influence of iron and correlations between nutrients and the
various carbonate parameters. The changes in the concentration of the pCO 2 , nitrate, and
fluorescence in and out of the fertilized patch are shown in Figure 9.26. The silicate concentrations in the patch decreased to zero during the experiment, making the system limiting in this nutrient. A diel study of the patch showed daytime decreases of 27 μatm in
pCO 2 and 16 μmol kg –1 in TCO 2 .
The changes in carbon to nutrients during the experiment gave ΔNO 3 /ΔPO 4 = 14.3 ±
0.7, ΔC/ ΔNO 3 = 6.2 ± 0.2, ΔC/ ΔPO 4 = 90 ± 5, ΔC/ ΔO 2 = –0.66 ± 0.07, ΔC/ ΔSiO 2 = 5.05 ± 0.3.
Corrections for the flux of gases across the air–sea interface during the experiment affected
Fe(II)
Fast
Fe(III)
Fe-DOC
Colloid
Fast
Slow
Slow
Settleable
Particle
Fast
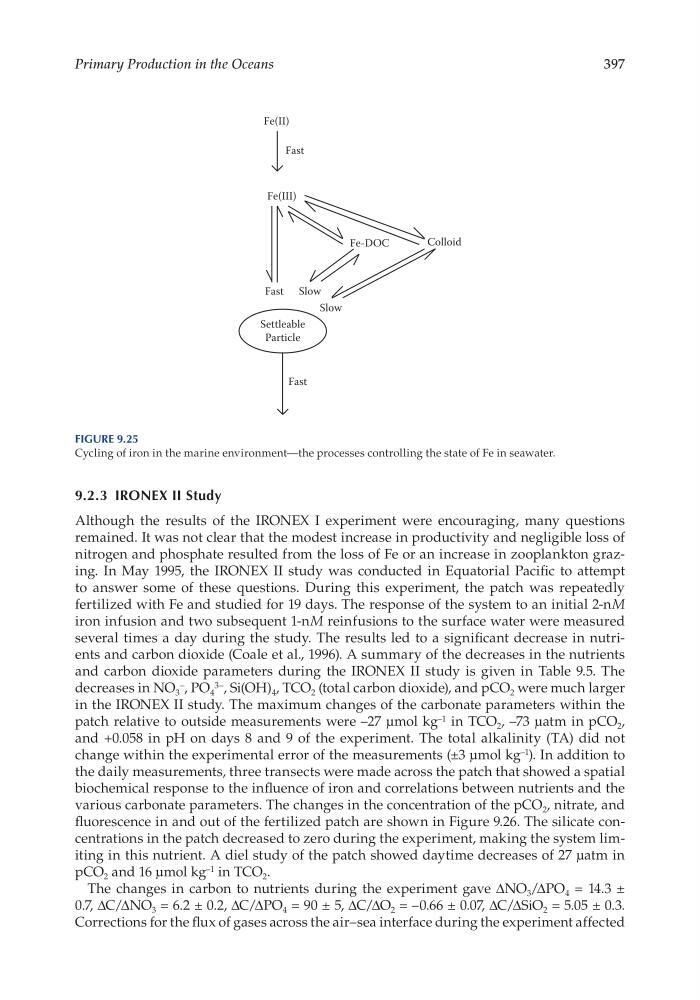
Figure 9.25
Cycling of iron in the marine environment—the processes controlling the state of Fe in seawater.
Primary Production in the Oceans
9.2.3 irONeX ii Study
Although the results of the IRONEX I experiment were encouraging, many questions
remained. It was not clear that the modest increase in productivity and negligible loss of
nitrogen and phosphate resulted from the loss of Fe or an increase in zooplankton grazing. In May 1995, the IRONEX II study was conducted in Equatorial Pacific to attempt
to answer some of these questions. During this experiment, the patch was repeatedly
fertilized with Fe and studied for 19 days. The response of the system to an initial 2-nM
iron infusion and two subsequent 1-nM reinfusions to the surface water were measured
several times a day during the study. The results led to a significant decrease in nutrients and carbon dioxide (Coale et al., 1996). A summary of the decreases in the nutrients
and carbon dioxide parameters during the IRONEX II study is given in Table 9.5. The
decreases in NO 3
– , PO 4
3– , Si(OH) 4 , TCO 2 (total carbon dioxide), and pCO 2 were much larger
in the IRONEX II study. The maximum changes of the carbonate parameters within the
patch relative to outside measurements were –27 μmol kg –1 in TCO 2 , –73 μatm in pCO 2 ,
and +0.058 in pH on days 8 and 9 of the experiment. The total alkalinity (TA) did not
change within the experimental error of the measurements (±3 μmol kg –1 ). In addition to
the daily measurements, three transects were made across the patch that showed a spatial
biochemical response to the influence of iron and correlations between nutrients and the
various carbonate parameters. The changes in the concentration of the pCO 2 , nitrate, and
fluorescence in and out of the fertilized patch are shown in Figure 9.26. The silicate concentrations in the patch decreased to zero during the experiment, making the system limiting in this nutrient. A diel study of the patch showed daytime decreases of 27 μatm in
pCO 2 and 16 μmol kg –1 in TCO 2 .
The changes in carbon to nutrients during the experiment gave ΔNO 3 /ΔPO 4 = 14.3 ±
0.7, ΔC/ ΔNO 3 = 6.2 ± 0.2, ΔC/ ΔPO 4 = 90 ± 5, ΔC/ ΔO 2 = –0.66 ± 0.07, ΔC/ ΔSiO 2 = 5.05 ± 0.3.
Corrections for the flux of gases across the air–sea interface during the experiment affected
Fe(II)
Fast
Fe(III)
Fe-DOC
Colloid
Fast
Slow
Slow
Settleable
Particle
Fast
Figure 9.25
Cycling of iron in the marine environment—the processes controlling the state of Fe in seawater.