

390
Chemical Oceanography, 4th Edition
phosphate, and silicate concentrations within the mixed layer between inside and outside
stations. The ratio of nitrate uptake to chlorophyll production in incubated Fe experiments
is approximately 1 mole NO 3
– g –1 Chl. A chlorophyll increase of 0.5 μg L –1 should be accompanied by a nitrate change of about 0.5 μM. Initial nitrate concentrations were 10.8 μM.
The day- to- day precision of the nitrate measurements (±0.4 μM) was insufficient to detect
a 0.5-μM decrease. Phosphate and silicate also showed no definitive change over this time
period inside the patch.
Ammonia, however, showed a consistent difference between the inside and outside stations. After fertilization, the mean ammonia concentrations measured inside the patch after
3 days were 0.1 ± 0.07 μM lower than the values observed outside the patch. An ammonia
maximum with values near 0.45 μM was regularly found near the base of the mixed layer
outside the patch. This maximum disappeared within the fertilized patch, and, with one
exception, no ammonia concentrations higher than 0.12 μM were found inside the patch.
Preferential uptake of ammonia would be expected as physiological rates increased.
The measurements of CO 2 fugacity and total CO 2 in the patch (Table 9.6) were significantly lower (3 to 12 μatm and 6 μM) than those observed outside the patch (Watson et al.,
1994). These changes were apparent within 2 days of the iron release. Biomass increase estimated from microscopic counts of cells was 20 μg C L –1 . If the inorganic carbon decreased
by the same amount, the fugacity of CO 2 in the mixed layer should decrease by 3 μatm
per day in the fertilized patch. If the CO 2 fugacity decrease were four times larger (upper
range measured) than that predicted from the observed increase in biomass, then a large
amount of the carbon may have been lost from the patch.
Chlorophyll (mg m
–3 )
0.0
0.2
0.4
0.6
0.8
Depth (m)
0
10
20
30
40
50
60
70
80
In
Patch
Out
Patch
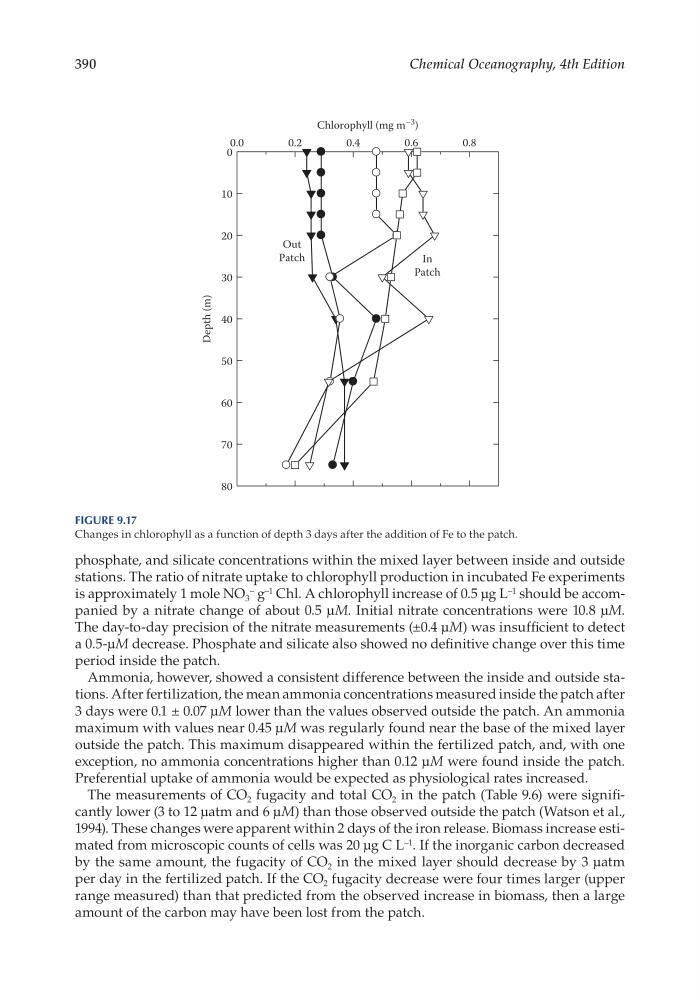
Figure 9.17
Changes in chlorophyll as a function of depth 3 days after the addition of Fe to the patch.
Chemical Oceanography, 4th Edition
phosphate, and silicate concentrations within the mixed layer between inside and outside
stations. The ratio of nitrate uptake to chlorophyll production in incubated Fe experiments
is approximately 1 mole NO 3
– g –1 Chl. A chlorophyll increase of 0.5 μg L –1 should be accompanied by a nitrate change of about 0.5 μM. Initial nitrate concentrations were 10.8 μM.
The day- to- day precision of the nitrate measurements (±0.4 μM) was insufficient to detect
a 0.5-μM decrease. Phosphate and silicate also showed no definitive change over this time
period inside the patch.
Ammonia, however, showed a consistent difference between the inside and outside stations. After fertilization, the mean ammonia concentrations measured inside the patch after
3 days were 0.1 ± 0.07 μM lower than the values observed outside the patch. An ammonia
maximum with values near 0.45 μM was regularly found near the base of the mixed layer
outside the patch. This maximum disappeared within the fertilized patch, and, with one
exception, no ammonia concentrations higher than 0.12 μM were found inside the patch.
Preferential uptake of ammonia would be expected as physiological rates increased.
The measurements of CO 2 fugacity and total CO 2 in the patch (Table 9.6) were significantly lower (3 to 12 μatm and 6 μM) than those observed outside the patch (Watson et al.,
1994). These changes were apparent within 2 days of the iron release. Biomass increase estimated from microscopic counts of cells was 20 μg C L –1 . If the inorganic carbon decreased
by the same amount, the fugacity of CO 2 in the mixed layer should decrease by 3 μatm
per day in the fertilized patch. If the CO 2 fugacity decrease were four times larger (upper
range measured) than that predicted from the observed increase in biomass, then a large
amount of the carbon may have been lost from the patch.
Chlorophyll (mg m
–3 )
0.0
0.2
0.4
0.6
0.8
Depth (m)
0
10
20
30
40
50
60
70
80
In
Patch
Out
Patch
Figure 9.17
Changes in chlorophyll as a function of depth 3 days after the addition of Fe to the patch.