

364
Chemical Oceanography, 4th Edition
The change in the NO 3
– to CO 2 can be estimated from the Redfield ratio:
ΔNO 3
– /ΔCO 2 = 16/106
(8.44)
The substitution into Equation 8.42 gives
–ΔO 2 = (2 + 106/16) ΔNO 3
– = 9ΔNO 3
–
(8.45)
The preformed NO 3
– concentration is thus related to the measured value by
[NO 3
– ] P = [NO 3
– ] MEAS – 1/9 AOU
(8.46)
Substituting AOU = [O 2 ] CALC – [O 2 ] MEAS into Equation 8.45 gives, on rearrangement,
“NO” = 9[NO 3
– ] MEAS + [O 2 ] MEAS = 9[NO 3
– ] P + [O 2 ] CAL
(8.47)
where “NO” is a conservative tracer. By a similar argument, it is possible to describe a
conservative tracer using phosphate:
“PO” = 135 [PO 4
3– ] meas + [O 2 ] meas
(8.48)
where “PO” is a conservative tracer. Since the concentration of NO 3
– is higher and can be
measured more accurately than the PO 4
3– , “NO” is a better conservative tracer than “PO.”
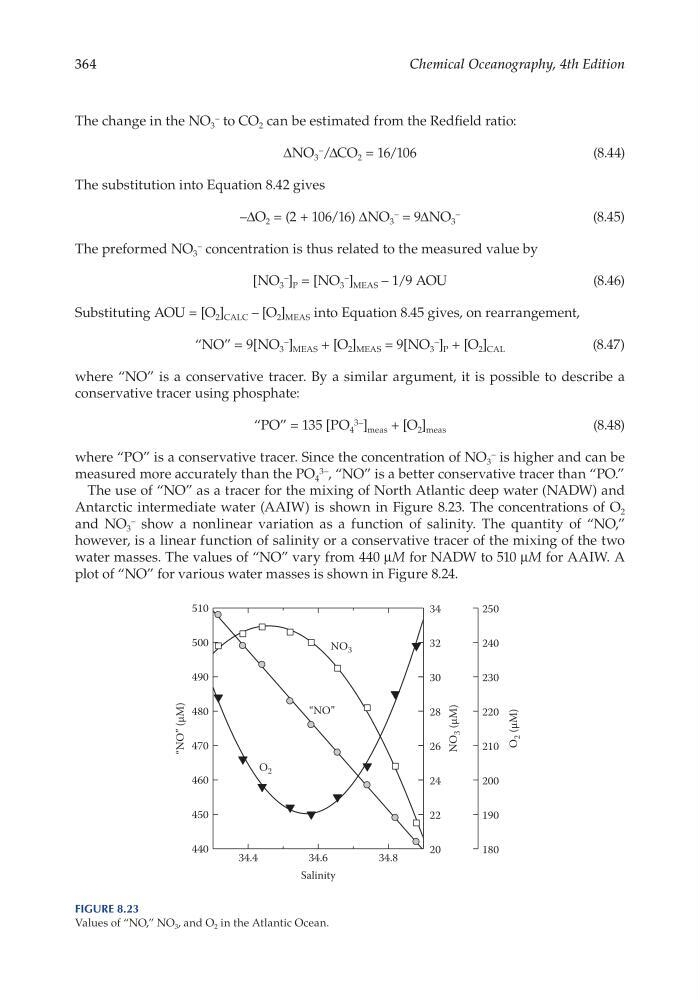
The use of “NO” as a tracer for the mixing of North Atlantic deep water (NADW) and
Antarctic intermediate water (AAIW) is shown in Figure 8.23. The concentrations of O 2
and NO 3
– show a nonlinear variation as a function of salinity. The quantity of “NO,”
however, is a linear function of salinity or a conservative tracer of the mixing of the two
water masses. The values of “NO” vary from 440 μM for NADW to 510 μM for AAIW. A
plot of “NO” for various water masses is shown in Figure 8.24.
Salinity
34.4
34.6
34.8
440
450
460
470
480
490
500
510
NO
3 (µM)
20
22
24
26
28
30
32
34
180
190
200
210
220
230
240
250
O 2
“NO”
NO 3
O
2 (µM)
“NO” (µM)
Figure 8.23
Values of “NO,” NO 3 , and O 2 in the Atlantic Ocean.
Chemical Oceanography, 4th Edition
The change in the NO 3
– to CO 2 can be estimated from the Redfield ratio:
ΔNO 3
– /ΔCO 2 = 16/106
(8.44)
The substitution into Equation 8.42 gives
–ΔO 2 = (2 + 106/16) ΔNO 3
– = 9ΔNO 3
–
(8.45)
The preformed NO 3
– concentration is thus related to the measured value by
[NO 3
– ] P = [NO 3
– ] MEAS – 1/9 AOU
(8.46)
Substituting AOU = [O 2 ] CALC – [O 2 ] MEAS into Equation 8.45 gives, on rearrangement,
“NO” = 9[NO 3
– ] MEAS + [O 2 ] MEAS = 9[NO 3
– ] P + [O 2 ] CAL
(8.47)
where “NO” is a conservative tracer. By a similar argument, it is possible to describe a
conservative tracer using phosphate:
“PO” = 135 [PO 4
3– ] meas + [O 2 ] meas
(8.48)
where “PO” is a conservative tracer. Since the concentration of NO 3
– is higher and can be
measured more accurately than the PO 4
3– , “NO” is a better conservative tracer than “PO.”
The use of “NO” as a tracer for the mixing of North Atlantic deep water (NADW) and
Antarctic intermediate water (AAIW) is shown in Figure 8.23. The concentrations of O 2
and NO 3
– show a nonlinear variation as a function of salinity. The quantity of “NO,”
however, is a linear function of salinity or a conservative tracer of the mixing of the two
water masses. The values of “NO” vary from 440 μM for NADW to 510 μM for AAIW. A
plot of “NO” for various water masses is shown in Figure 8.24.
Salinity
34.4
34.6
34.8
440
450
460
470
480
490
500
510
NO
3 (µM)
20
22
24
26
28
30
32
34
180
190
200
210
220
230
240
250
O 2
“NO”
NO 3
O
2 (µM)
“NO” (µM)
Figure 8.23
Values of “NO,” NO 3 , and O 2 in the Atlantic Ocean.