

356
Chemical Oceanography, 4th Edition
are 15.3 ± 0.7, 15.3 ± 0.9, and 15.3 ± 0.8, respectively, for the Atlantic, Pacific, and Indian
Oceans. The values in the Atlantic show a reasonable distribution around the fitted line.
The values of NO 3
– at low ratios of N:P in the Pacific and Indian Oceans go to zero before
PO 4
3– . This clearly shows that nitrate is limiting to growth in these surface waters. At high
values of N and P the values show a negative deviation from the regression line. This is
related to the use of NO 3
– as an oxidant by bacteria when the oxygen levels are very low.
The differences in the N:P ratio in the surface waters in the Atlantic and Pacific from the
BATS and Hawaii Ocean Time Series (HOT) stations are shown more clearly in Figure 8.20.
The high values of N and P in the waters off Bermuda are due to nitrification (N 2 → NH 3
→ NO 3
– ) by cyanobacteria, while the low values off Hawaii are due to denitrification
(NO 3
– → N 2 O or N 2 ) by bacteria.
In 1934, Redfield examined the relationship between the concentrations of O 2 , CO 2 ,
NO 3
– , and PO 4
3– in seawater based on the average chemical composition of plankton. This
relationship predicts the ratio of oxygen consumption to nutrient production caused by
biological oxidation. In the North Atlantic, he found an N:P ratio of 20:1. He also found an
apparent O 2 utilization to NO 3
– of 6:1. He found variations that he attributed to preformed
concentrations in the deep waters that originated before the waters sank. He estimated
an N:C ratio of 1:7. He proposed an oxidation ratio of P:N:C of 1:20:140 accompanied by
120 units of O 2 . These ratios supported the plankton sample ratios of 1:18:137. Redfield,
Ketchum, and Richards (1963) proposed a revised ratio of 1:16:106:138 for P:N:C:O. These
results led to the following equation for the oxidation of plant material:
(CH 2 O) 106 (NH 3 ) 16 (H 3 PO 4 ) + 138O 2 → 106CO 2 + 122H 2 O + 16HNO 3 + H 3 PO 4 (8.31)
N/P
8
10
12
14
16
18
20
Depth (m)
0
1000
2000
3000
4000
5000
6000
N. Atlantic
N. Pacific
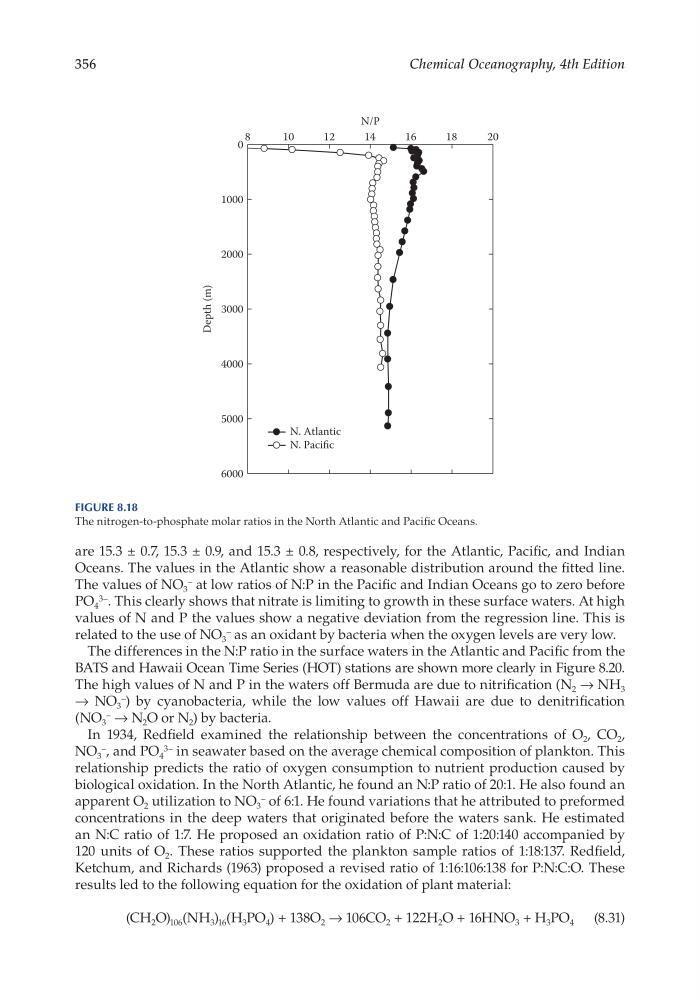
Figure 8.18
The nitrogen- to- phosphate molar ratios in the North Atlantic and Pacific Oceans.
Chemical Oceanography, 4th Edition
are 15.3 ± 0.7, 15.3 ± 0.9, and 15.3 ± 0.8, respectively, for the Atlantic, Pacific, and Indian
Oceans. The values in the Atlantic show a reasonable distribution around the fitted line.
The values of NO 3
– at low ratios of N:P in the Pacific and Indian Oceans go to zero before
PO 4
3– . This clearly shows that nitrate is limiting to growth in these surface waters. At high
values of N and P the values show a negative deviation from the regression line. This is
related to the use of NO 3
– as an oxidant by bacteria when the oxygen levels are very low.
The differences in the N:P ratio in the surface waters in the Atlantic and Pacific from the
BATS and Hawaii Ocean Time Series (HOT) stations are shown more clearly in Figure 8.20.
The high values of N and P in the waters off Bermuda are due to nitrification (N 2 → NH 3
→ NO 3
– ) by cyanobacteria, while the low values off Hawaii are due to denitrification
(NO 3
– → N 2 O or N 2 ) by bacteria.
In 1934, Redfield examined the relationship between the concentrations of O 2 , CO 2 ,
NO 3
– , and PO 4
3– in seawater based on the average chemical composition of plankton. This
relationship predicts the ratio of oxygen consumption to nutrient production caused by
biological oxidation. In the North Atlantic, he found an N:P ratio of 20:1. He also found an
apparent O 2 utilization to NO 3
– of 6:1. He found variations that he attributed to preformed
concentrations in the deep waters that originated before the waters sank. He estimated
an N:C ratio of 1:7. He proposed an oxidation ratio of P:N:C of 1:20:140 accompanied by
120 units of O 2 . These ratios supported the plankton sample ratios of 1:18:137. Redfield,
Ketchum, and Richards (1963) proposed a revised ratio of 1:16:106:138 for P:N:C:O. These
results led to the following equation for the oxidation of plant material:
(CH 2 O) 106 (NH 3 ) 16 (H 3 PO 4 ) + 138O 2 → 106CO 2 + 122H 2 O + 16HNO 3 + H 3 PO 4 (8.31)
N/P
8
10
12
14
16
18
20
Depth (m)
0
1000
2000
3000
4000
5000
6000
N. Atlantic
N. Pacific
Figure 8.18
The nitrogen- to- phosphate molar ratios in the North Atlantic and Pacific Oceans.