

355
Micronutrients in the Oceans
the smallest quantity relative to the requirement for growth of an organism will be the
limiting factor), it is clear that the P:N is limiting compared to carbon (the actual P:C ratio
is ~1000). Typical values of N:P in the North Atlantic and Pacific Oceans are shown in
Figure 8.18. The ratios of the waters in the Atlantic vary from 16:1 at the surface to 15:1
in deep waters. The deep waters in the Pacific are also close to 15:1, but the waters in the
O 2 minimum layer are as low as 14:1. This is due to the conversion of NO 3
– to N 2 O in these
low- oxygen waters as discussed previously.
The higher values of the N and P in the North Atlantic may be due to nitrogen fixation.
The values of N and P from the WOCE studies on some cruises in the Atlantic (A16), Pacific
(P16), and Indian Oceans (I8) are shown in Figure 8.19. The least- square values of the ratios
45
10
0
5
10
15
20
TDN: TDP
25
30
35
40
45
15
20
25
30
Latitude (deg N)
35
40
0
1
2
3
4
N (µM)
5
6
7
8
Subtropical
Gyre
Subtropical
Transition
Subarctic
Frontal
Equatorial
Transition
0.0
0.1
0.2
0.3
0.4
P (µM)
0.5
TOP
PO 4
0.6
0.7
0.8
TON
DIN
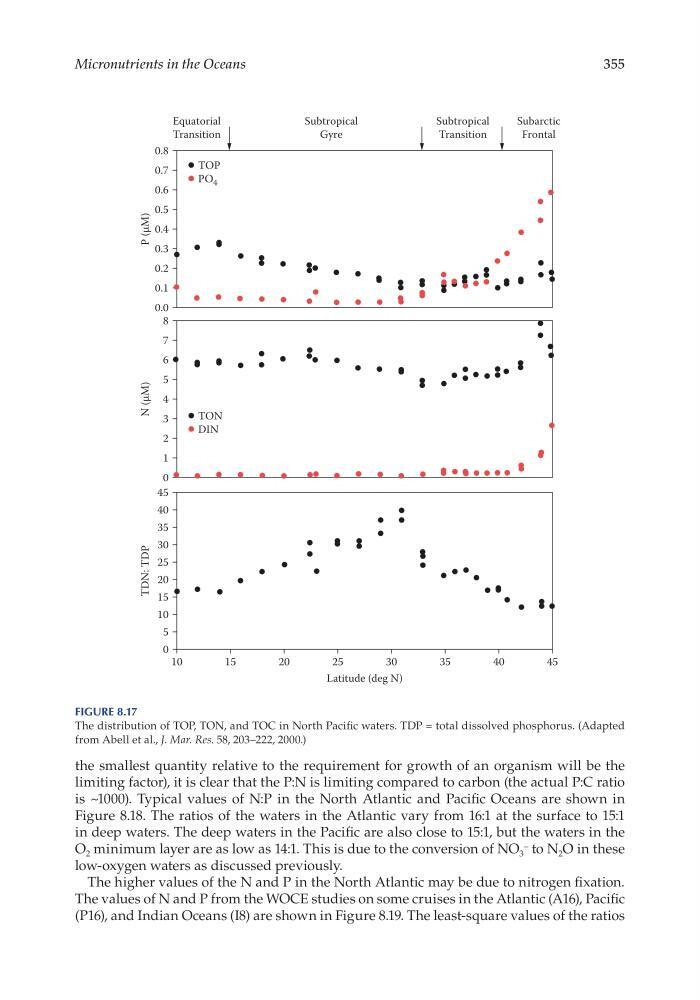
Figure 8.17
The distribution of TOP, TON, and TOC in North Pacific waters. TDP = total dissolved phosphorus. (Adapted
from Abell et al., J. Mar. Res. 58, 203–222, 2000.)
Micronutrients in the Oceans
the smallest quantity relative to the requirement for growth of an organism will be the
limiting factor), it is clear that the P:N is limiting compared to carbon (the actual P:C ratio
is ~1000). Typical values of N:P in the North Atlantic and Pacific Oceans are shown in
Figure 8.18. The ratios of the waters in the Atlantic vary from 16:1 at the surface to 15:1
in deep waters. The deep waters in the Pacific are also close to 15:1, but the waters in the
O 2 minimum layer are as low as 14:1. This is due to the conversion of NO 3
– to N 2 O in these
low- oxygen waters as discussed previously.
The higher values of the N and P in the North Atlantic may be due to nitrogen fixation.
The values of N and P from the WOCE studies on some cruises in the Atlantic (A16), Pacific
(P16), and Indian Oceans (I8) are shown in Figure 8.19. The least- square values of the ratios
45
10
0
5
10
15
20
TDN: TDP
25
30
35
40
45
15
20
25
30
Latitude (deg N)
35
40
0
1
2
3
4
N (µM)
5
6
7
8
Subtropical
Gyre
Subtropical
Transition
Subarctic
Frontal
Equatorial
Transition
0.0
0.1
0.2
0.3
0.4
P (µM)
0.5
TOP
PO 4
0.6
0.7
0.8
TON
DIN
Figure 8.17
The distribution of TOP, TON, and TOC in North Pacific waters. TDP = total dissolved phosphorus. (Adapted
from Abell et al., J. Mar. Res. 58, 203–222, 2000.)