

352
Chemical Oceanography, 4th Edition
produced is proportional to the AOU (apparent oxygen utilization). One molecule of
N 2 O is produced for every 10,000 molecules of O 2 utilized by NO 3
– . When the waters
have low concentrations of oxygen, the relationship between N 2 O and O 2 is broken (see
Figure 8.16). This is caused by the utilization of N 2 O as a source of oxygen when O 2
levels are very low.
8.3.3 Dissolved Organic Nitrogen and Phosphate
As shown previously (Figure 8.3), the total organic phosphate in ocean waters is defined
as the differences between the total and inorganic value. Total organic nitrate can be
described in a similar manner.
TOP = [PO 4 ] T – [PO 4 ]
TON = [NO 3 ] T – [NO 3 ]
It should be pointed out that the dissolved organic nitrogen (DON) and phosphate (DOP)
are the values after filtration. The differences are small for most waters. Abell, Emerson,
and Renaud (2000) examined the distribution of TOP, TON, and TOC in a North Pacific
subtropical gyre. The Abell, Emerson, and Renaud (2000) surface water results are summarized in Figure 8.17. The values of TOP and TON in surface waters are 83 and 98%,
NO 2
– (µM)
0.0
0.5
1.0
1.5
2.0
2.5
Depth (m)
0
100
200
300
400
500
NO 3
– (µM)
0
10
20
30
40
50
NO 2
–
NO 3
–
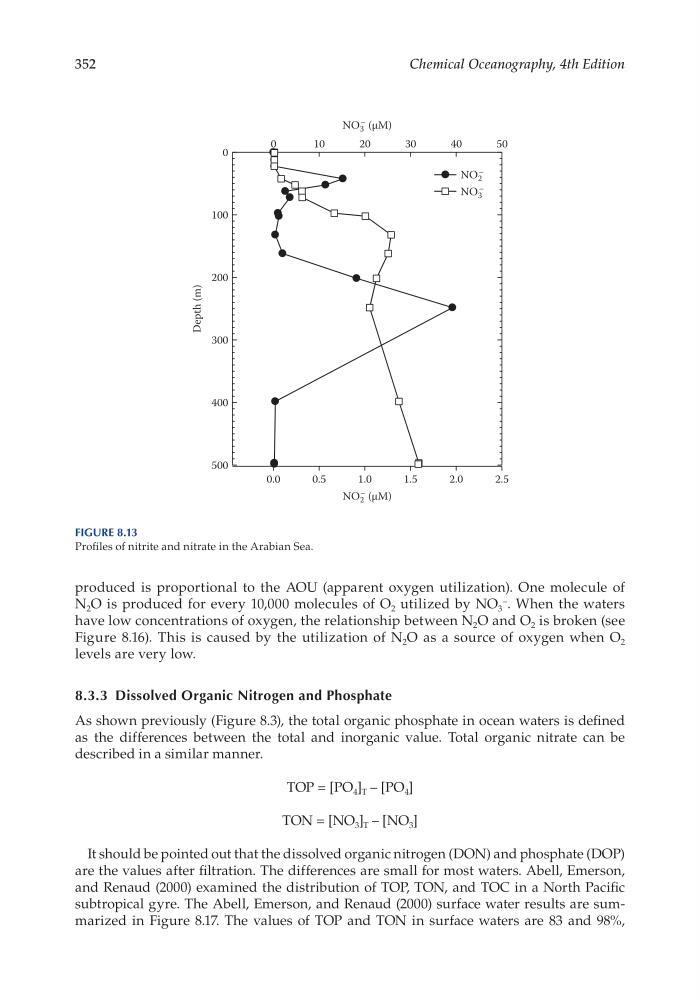
Figure 8.13
Profiles of nitrite and nitrate in the Arabian Sea.
Chemical Oceanography, 4th Edition
produced is proportional to the AOU (apparent oxygen utilization). One molecule of
N 2 O is produced for every 10,000 molecules of O 2 utilized by NO 3
– . When the waters
have low concentrations of oxygen, the relationship between N 2 O and O 2 is broken (see
Figure 8.16). This is caused by the utilization of N 2 O as a source of oxygen when O 2
levels are very low.
8.3.3 Dissolved Organic Nitrogen and Phosphate
As shown previously (Figure 8.3), the total organic phosphate in ocean waters is defined
as the differences between the total and inorganic value. Total organic nitrate can be
described in a similar manner.
TOP = [PO 4 ] T – [PO 4 ]
TON = [NO 3 ] T – [NO 3 ]
It should be pointed out that the dissolved organic nitrogen (DON) and phosphate (DOP)
are the values after filtration. The differences are small for most waters. Abell, Emerson,
and Renaud (2000) examined the distribution of TOP, TON, and TOC in a North Pacific
subtropical gyre. The Abell, Emerson, and Renaud (2000) surface water results are summarized in Figure 8.17. The values of TOP and TON in surface waters are 83 and 98%,
NO 2
– (µM)
0.0
0.5
1.0
1.5
2.0
2.5
Depth (m)
0
100
200
300
400
500
NO 3
– (µM)
0
10
20
30
40
50
NO 2
–
NO 3
–
Figure 8.13
Profiles of nitrite and nitrate in the Arabian Sea.