

349
Micronutrients in the Oceans
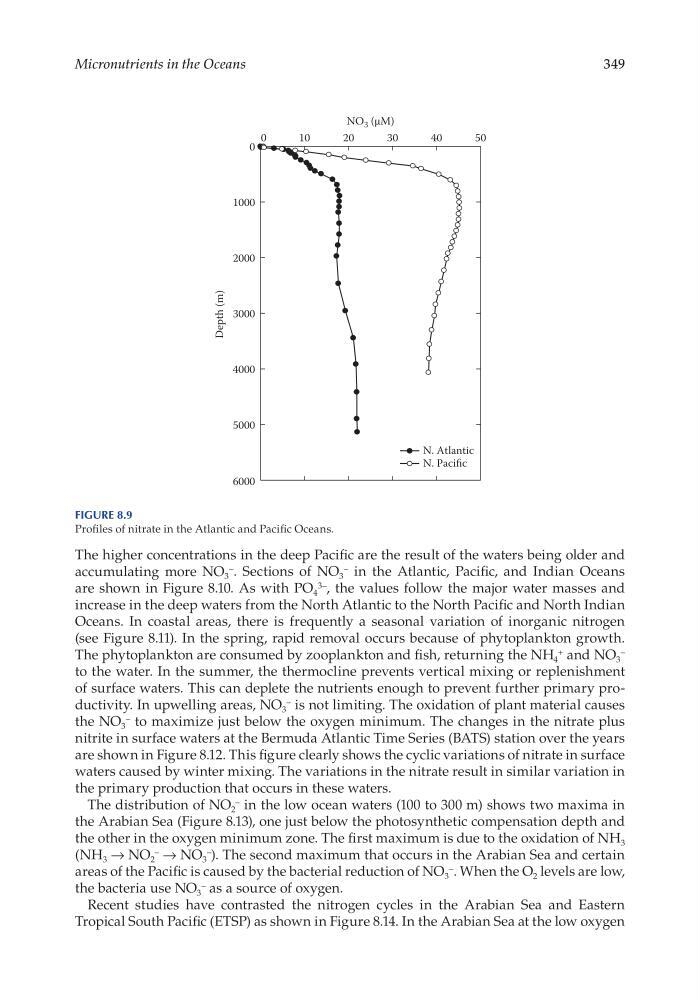
The higher concentrations in the deep Pacific are the result of the waters being older and
accumulating more NO 3
– . Sections of NO 3
– in the Atlantic, Pacific, and Indian Oceans
are shown in Figure 8.10. As with PO 4
3– , the values follow the major water masses and
increase in the deep waters from the North Atlantic to the North Pacific and North Indian
Oceans. In coastal areas, there is frequently a seasonal variation of inorganic nitrogen
(see Figure 8.11). In the spring, rapid removal occurs because of phytoplankton growth.
The phytoplankton are consumed by zooplankton and fish, returning the NH 4
+ and NO 3
–
to the water. In the summer, the thermocline prevents vertical mixing or replenishment
of surface waters. This can deplete the nutrients enough to prevent further primary productivity. In upwelling areas, NO 3
– is not limiting. The oxidation of plant material causes
the NO 3
– to maximize just below the oxygen minimum. The changes in the nitrate plus
nitrite in surface waters at the Bermuda Atlantic Time Series (BATS) station over the years
are shown in Figure 8.12. This figure clearly shows the cyclic variations of nitrate in surface
waters caused by winter mixing. The variations in the nitrate result in similar variation in
the primary production that occurs in these waters.
The distribution of NO 2
– in the low ocean waters (100 to 300 m) shows two maxima in
the Arabian Sea (Figure 8.13), one just below the photosynthetic compensation depth and
the other in the oxygen minimum zone. The first maximum is due to the oxidation of NH 3
(NH 3 → NO 2
– → NO 3
– ). The second maximum that occurs in the Arabian Sea and certain
areas of the Pacific is caused by the bacterial reduction of NO 3
– . When the O 2 levels are low,
the bacteria use NO 3
– as a source of oxygen.
Recent studies have contrasted the nitrogen cycles in the Arabian Sea and Eastern
Tropical South Pacific (ETSP) as shown in Figure 8.14. In the Arabian Sea at the low oxygen
NO 3 (µM)
0
10
20
30
40
50
Depth (m)
0
1000
2000
3000
4000
5000
6000
N. Atlantic
N. Pacific
Figure 8.9
Profiles of nitrate in the Atlantic and Pacific Oceans.
Micronutrients in the Oceans
The higher concentrations in the deep Pacific are the result of the waters being older and
accumulating more NO 3
– . Sections of NO 3
– in the Atlantic, Pacific, and Indian Oceans
are shown in Figure 8.10. As with PO 4
3– , the values follow the major water masses and
increase in the deep waters from the North Atlantic to the North Pacific and North Indian
Oceans. In coastal areas, there is frequently a seasonal variation of inorganic nitrogen
(see Figure 8.11). In the spring, rapid removal occurs because of phytoplankton growth.
The phytoplankton are consumed by zooplankton and fish, returning the NH 4
+ and NO 3
–
to the water. In the summer, the thermocline prevents vertical mixing or replenishment
of surface waters. This can deplete the nutrients enough to prevent further primary productivity. In upwelling areas, NO 3
– is not limiting. The oxidation of plant material causes
the NO 3
– to maximize just below the oxygen minimum. The changes in the nitrate plus
nitrite in surface waters at the Bermuda Atlantic Time Series (BATS) station over the years
are shown in Figure 8.12. This figure clearly shows the cyclic variations of nitrate in surface
waters caused by winter mixing. The variations in the nitrate result in similar variation in
the primary production that occurs in these waters.
The distribution of NO 2
– in the low ocean waters (100 to 300 m) shows two maxima in
the Arabian Sea (Figure 8.13), one just below the photosynthetic compensation depth and
the other in the oxygen minimum zone. The first maximum is due to the oxidation of NH 3
(NH 3 → NO 2
– → NO 3
– ). The second maximum that occurs in the Arabian Sea and certain
areas of the Pacific is caused by the bacterial reduction of NO 3
– . When the O 2 levels are low,
the bacteria use NO 3
– as a source of oxygen.
Recent studies have contrasted the nitrogen cycles in the Arabian Sea and Eastern
Tropical South Pacific (ETSP) as shown in Figure 8.14. In the Arabian Sea at the low oxygen
NO 3 (µM)
0
10
20
30
40
50
Depth (m)
0
1000
2000
3000
4000
5000
6000
N. Atlantic
N. Pacific
Figure 8.9
Profiles of nitrate in the Atlantic and Pacific Oceans.