

16
Chemical Oceanography, 4th Edition
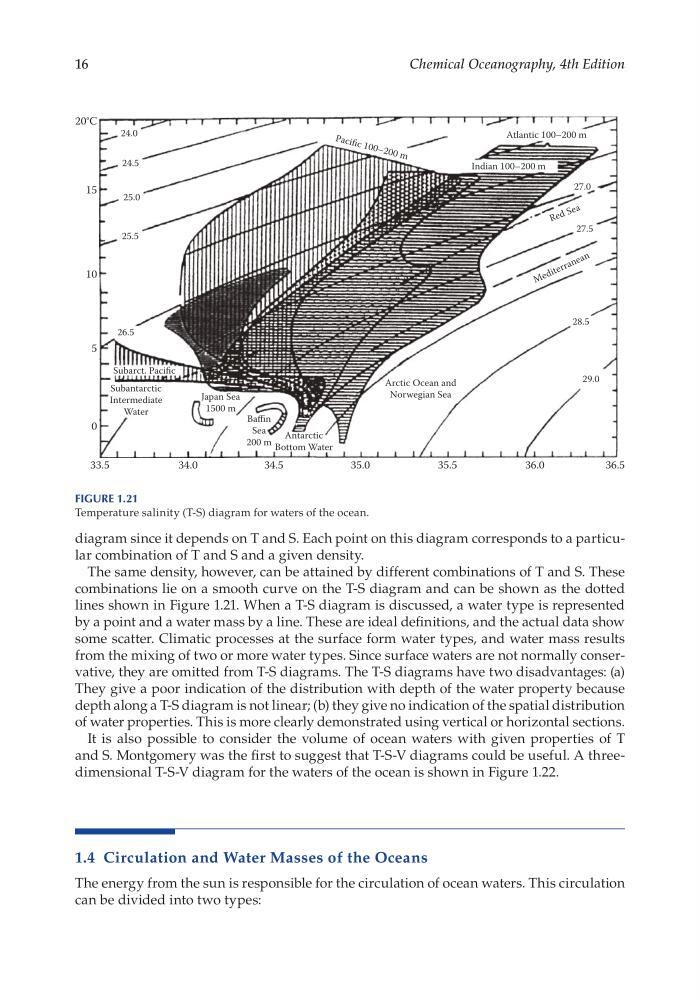
diagram since it depends on T and S. Each point on this diagram corresponds to a particular combination of T and S and a given density.
The same density, however, can be attained by different combinations of T and S. These
combinations lie on a smooth curve on the T-S diagram and can be shown as the dotted
lines shown in Figure 1.21. When a T-S diagram is discussed, a water type is represented
by a point and a water mass by a line. These are ideal definitions, and the actual data show
some scatter. Climatic processes at the surface form water types, and water mass results
from the mixing of two or more water types. Since surface waters are not normally conservative, they are omitted from T- S diagrams. The T- S diagrams have two disadvantages: (a)
They give a poor indication of the distribution with depth of the water property because
depth along a T-S diagram is not linear; (b) they give no indication of the spatial distribution
of water properties. This is more clearly demonstrated using vertical or horizontal sections.
It is also possible to consider the volume of ocean waters with given properties of T
and S. Montgomery was the first to suggest that T- S-V diagrams could be useful. A threedimensional T- S-V diagram for the waters of the ocean is shown in Figure 1.22.
1.4 Circulation and Water Masses of the Oceans
The energy from the sun is responsible for the circulation of ocean waters. This circulation
can be divided into two types:
20°C
15
10
5
0
36.5
36.0
35.5
35.0
34.5
34.0
33.5
24.0
24.5
25.0
25.5
26.5
Subarct. Pacific
Subantarctic
Intermediate
Water
Antarctic
Bottom Water
Japan Sea
1500 m
Baffin
Sea
200 m
Arctic Ocean and
Norwegian Sea
28.5
27.5
27.0
29.0
M e d it e r r a n e a n
R e d S e a
Atlantic 100–200 m
Indian 100–200 m
Pa ci fic 10 0– 20 0 m
Figure 1.21
Temperature salinity (T- S) diagram for waters of the ocean.
Chemical Oceanography, 4th Edition
diagram since it depends on T and S. Each point on this diagram corresponds to a particular combination of T and S and a given density.
The same density, however, can be attained by different combinations of T and S. These
combinations lie on a smooth curve on the T-S diagram and can be shown as the dotted
lines shown in Figure 1.21. When a T-S diagram is discussed, a water type is represented
by a point and a water mass by a line. These are ideal definitions, and the actual data show
some scatter. Climatic processes at the surface form water types, and water mass results
from the mixing of two or more water types. Since surface waters are not normally conservative, they are omitted from T- S diagrams. The T- S diagrams have two disadvantages: (a)
They give a poor indication of the distribution with depth of the water property because
depth along a T-S diagram is not linear; (b) they give no indication of the spatial distribution
of water properties. This is more clearly demonstrated using vertical or horizontal sections.
It is also possible to consider the volume of ocean waters with given properties of T
and S. Montgomery was the first to suggest that T- S-V diagrams could be useful. A threedimensional T- S-V diagram for the waters of the ocean is shown in Figure 1.22.
1.4 Circulation and Water Masses of the Oceans
The energy from the sun is responsible for the circulation of ocean waters. This circulation
can be divided into two types:
20°C
15
10
5
0
36.5
36.0
35.5
35.0
34.5
34.0
33.5
24.0
24.5
25.0
25.5
26.5
Subarct. Pacific
Subantarctic
Intermediate
Water
Antarctic
Bottom Water
Japan Sea
1500 m
Baffin
Sea
200 m
Arctic Ocean and
Norwegian Sea
28.5
27.5
27.0
29.0
M e d it e r r a n e a n
R e d S e a
Atlantic 100–200 m
Indian 100–200 m
Pa ci fic 10 0– 20 0 m
Figure 1.21
Temperature salinity (T- S) diagram for waters of the ocean.