

344
Chemical Oceanography, 4th Edition
NO 3
– is determined by reducing it to NO 2
– , which is analyzed as given. The reduction
is carried out by treating the sample with NH 4 Cl or EDTA (ethylenediamine N,N,N,N′
tetraacetic acid) and passing it through a glass column packed with amalgamated or
copper- coated cadmium filings. No completely satisfactory method exists for the routine analysis of NH 3 and NH 4
+ , which are at very low concentrations in oxygenated
Atlantic
0
Atlantic Ocean A16
Pacific Ocean P16
Indian Ocean I8
Phosphate (µmol/kg)
Phosphate (µmol/kg)
Phosphate (µmol/kg)
1000
2000
3000
4000
5000
6000
40°S
20°S
20°N
40°N
60°N
0
Ocean Data View
Ocean Data View
Ocean Data View
0.5
1.5
2
2.5
1
A16
P16
I8
EQ
40°S
20°S
20°N
40°N
EQ
40°S
60°S
20°S
EQ
0.5
1
1.5
2
2.5
0
0.5
1.5
2
2.5
3
1
Depth (m)
0
1000
2000
3000
4000
5000
Depth (m)
0
1000
2000
3000
4000
Depth (m)
Pacific
Indian
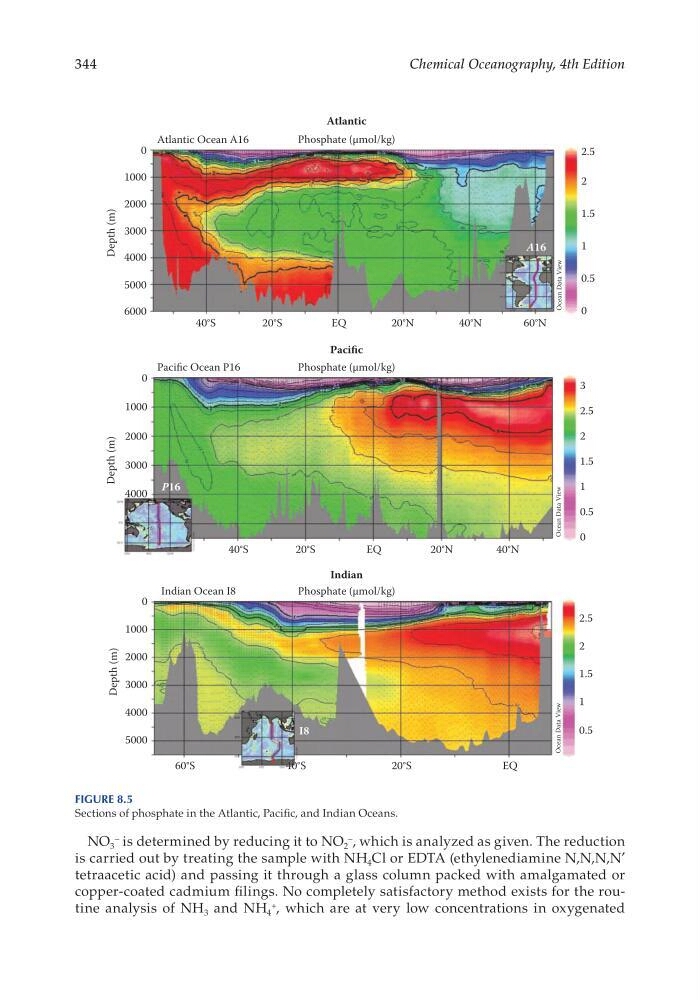
Figure 8.5
Sections of phosphate in the Atlantic, Pacific, and Indian Oceans.
Chemical Oceanography, 4th Edition
NO 3
– is determined by reducing it to NO 2
– , which is analyzed as given. The reduction
is carried out by treating the sample with NH 4 Cl or EDTA (ethylenediamine N,N,N,N′
tetraacetic acid) and passing it through a glass column packed with amalgamated or
copper- coated cadmium filings. No completely satisfactory method exists for the routine analysis of NH 3 and NH 4
+ , which are at very low concentrations in oxygenated
Atlantic
0
Atlantic Ocean A16
Pacific Ocean P16
Indian Ocean I8
Phosphate (µmol/kg)
Phosphate (µmol/kg)
Phosphate (µmol/kg)
1000
2000
3000
4000
5000
6000
40°S
20°S
20°N
40°N
60°N
0
Ocean Data View
Ocean Data View
Ocean Data View
0.5
1.5
2
2.5
1
A16
P16
I8
EQ
40°S
20°S
20°N
40°N
EQ
40°S
60°S
20°S
EQ
0.5
1
1.5
2
2.5
0
0.5
1.5
2
2.5
3
1
Depth (m)
0
1000
2000
3000
4000
5000
Depth (m)
0
1000
2000
3000
4000
Depth (m)
Pacific
Indian
Figure 8.5
Sections of phosphate in the Atlantic, Pacific, and Indian Oceans.