

321
The Carbonate System
this reaction is slower at low pH. Fe 3+ is more soluble in acidic solutions (Figure 7.75), so
its concentration also increases at low pH. So, both processes increase the concentration
of total Fe, which is good for primary production and nitrogen fixation. The lower pH can
increase the concentration of Cu 2+ and make it more toxic in seawater because the reduction of Cu 2+ to Cu + in surface waters with H 2 O 2 is increased at low concentrations of CO 3
2– .
As shown in Figure 7.76, the addition of borate has no effect on the reduction, while the
2100
2080
2060
2040
Year
2020
2000
300
400
500
600
700
800
900
1000
A1B
Scenarios
Atmospheric CO
2 Concentration (ppm)
A1T
A1F1
A2
B1
B2
IS92a
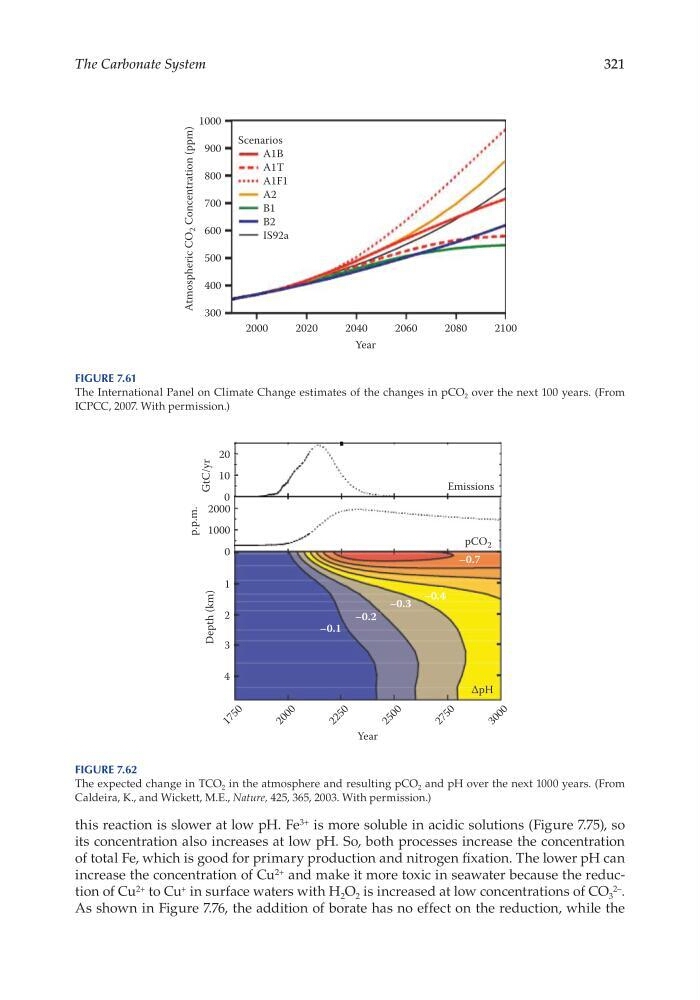
Figure 7.61
The International Panel on Climate Change estimates of the changes in pCO 2 over the next 100 years. (From
ICPCC, 2007. With permission.)
3 0 0 0
2 7 5 0
2 5 0 0
2 2 5 0
2 0 0 0
1 7 5 0
Year
∆pH
–0.1
–0.2
–0.3
–0.4
–0.7
4
3
2
1
0
Emissions
pCO 2
1000
2000
0
10
20
Depth (km)
p.p.m.
GtC/yr
Figure 7.62
The expected change in TCO 2 in the atmosphere and resulting pCO 2 and pH over the next 1000 years. (From
Caldeira, K., and Wickett, M.E., Nature, 425, 365, 2003. With permission.)
The Carbonate System
this reaction is slower at low pH. Fe 3+ is more soluble in acidic solutions (Figure 7.75), so
its concentration also increases at low pH. So, both processes increase the concentration
of total Fe, which is good for primary production and nitrogen fixation. The lower pH can
increase the concentration of Cu 2+ and make it more toxic in seawater because the reduction of Cu 2+ to Cu + in surface waters with H 2 O 2 is increased at low concentrations of CO 3
2– .
As shown in Figure 7.76, the addition of borate has no effect on the reduction, while the
2100
2080
2060
2040
Year
2020
2000
300
400
500
600
700
800
900
1000
A1B
Scenarios
Atmospheric CO
2 Concentration (ppm)
A1T
A1F1
A2
B1
B2
IS92a
Figure 7.61
The International Panel on Climate Change estimates of the changes in pCO 2 over the next 100 years. (From
ICPCC, 2007. With permission.)
3 0 0 0
2 7 5 0
2 5 0 0
2 2 5 0
2 0 0 0
1 7 5 0
Year
∆pH
–0.1
–0.2
–0.3
–0.4
–0.7
4
3
2
1
0
Emissions
pCO 2
1000
2000
0
10
20
Depth (km)
p.p.m.
GtC/yr
Figure 7.62
The expected change in TCO 2 in the atmosphere and resulting pCO 2 and pH over the next 1000 years. (From
Caldeira, K., and Wickett, M.E., Nature, 425, 365, 2003. With permission.)