

310
Chemical Oceanography, 4th Edition
calculated at pCO 2 = 280 μatm and the preformed TA (TA 0 ) in surface waters in 1800.
The calculation of ΔC* in surface waters is corrected for changes since leaving the surface
and for the mixing of various water masses.
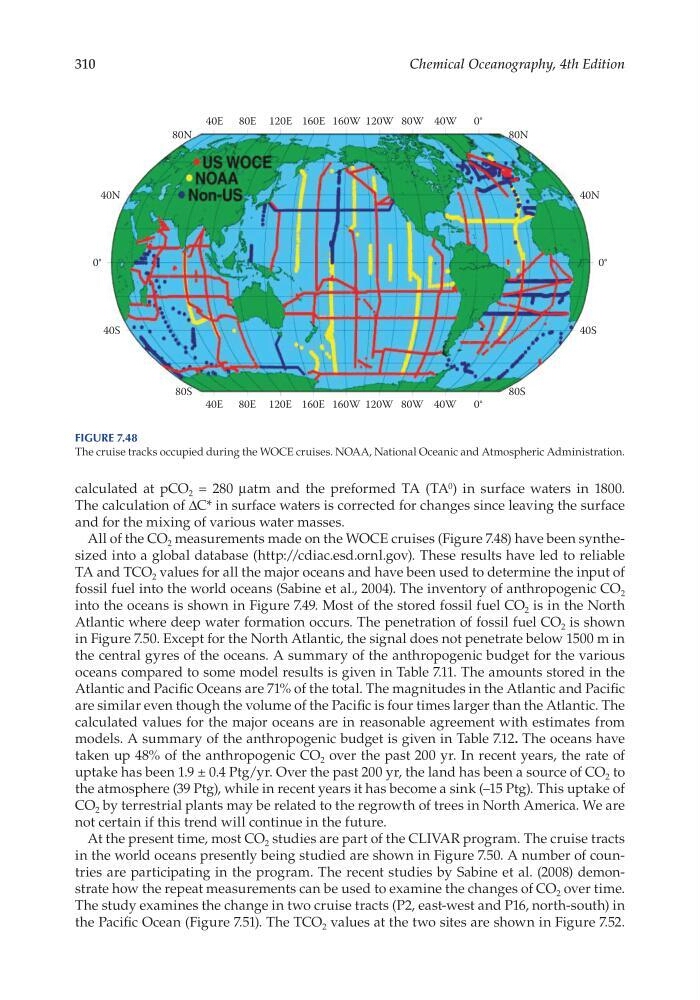
All of the CO 2 measurements made on the WOCE cruises (Figure 7.48) have been synthesized into a global database (http://cdiac.esd.ornl.gov). These results have led to reliable
TA and TCO 2 values for all the major oceans and have been used to determine the input of
fossil fuel into the world oceans (Sabine et al., 2004). The inventory of anthropogenic CO 2
into the oceans is shown in Figure 7.49. Most of the stored fossil fuel CO 2 is in the North
Atlantic where deep water formation occurs. The penetration of fossil fuel CO 2 is shown
in Figure 7.50. Except for the North Atlantic, the signal does not penetrate below 1500 m in
the central gyres of the oceans. A summary of the anthropogenic budget for the various
oceans compared to some model results is given in Table 7.11. The amounts stored in the
Atlantic and Pacific Oceans are 71% of the total. The magnitudes in the Atlantic and Pacific
are similar even though the volume of the Pacific is four times larger than the Atlantic. The
calculated values for the major oceans are in reasonable agreement with estimates from
models. A summary of the anthropogenic budget is given in Table 7.12. The oceans have
taken up 48% of the anthropogenic CO 2 over the past 200 yr. In recent years, the rate of
uptake has been 1.9 ± 0.4 Ptg/ yr. Over the past 200 yr, the land has been a source of CO 2 to
the atmosphere (39 Ptg), while in recent years it has become a sink (–15 Ptg). This uptake of
CO 2 by terrestrial plants may be related to the regrowth of trees in North America. We are
not certain if this trend will continue in the future.
At the present time, most CO 2 studies are part of the CLIVAR program. The cruise tracts
in the world oceans presently being studied are shown in Figure 7.50. A number of countries are participating in the program. The recent studies by Sabine et al. (2008) demonstrate how the repeat measurements can be used to examine the changes of CO 2 over time.
The study examines the change in two cruise tracts (P2, east- west and P16, north- south) in
the Pacific Ocean (Figure 7.51). The TCO 2 values at the two sites are shown in Figure 7.52.
40E 80E 120E 160E 160W 120W 80W 40W
40E 80E 120E 160E 160W 120W 80W 40W
0°
0°
80S
80S
80N
40S
40N
80N
40S
40N
0°
0°
Figure 7.48
The cruise tracks occupied during the WOCE cruises. NOAA, National Oceanic and Atmospheric Administration.
Chemical Oceanography, 4th Edition
calculated at pCO 2 = 280 μatm and the preformed TA (TA 0 ) in surface waters in 1800.
The calculation of ΔC* in surface waters is corrected for changes since leaving the surface
and for the mixing of various water masses.
All of the CO 2 measurements made on the WOCE cruises (Figure 7.48) have been synthesized into a global database (http://cdiac.esd.ornl.gov). These results have led to reliable
TA and TCO 2 values for all the major oceans and have been used to determine the input of
fossil fuel into the world oceans (Sabine et al., 2004). The inventory of anthropogenic CO 2
into the oceans is shown in Figure 7.49. Most of the stored fossil fuel CO 2 is in the North
Atlantic where deep water formation occurs. The penetration of fossil fuel CO 2 is shown
in Figure 7.50. Except for the North Atlantic, the signal does not penetrate below 1500 m in
the central gyres of the oceans. A summary of the anthropogenic budget for the various
oceans compared to some model results is given in Table 7.11. The amounts stored in the
Atlantic and Pacific Oceans are 71% of the total. The magnitudes in the Atlantic and Pacific
are similar even though the volume of the Pacific is four times larger than the Atlantic. The
calculated values for the major oceans are in reasonable agreement with estimates from
models. A summary of the anthropogenic budget is given in Table 7.12. The oceans have
taken up 48% of the anthropogenic CO 2 over the past 200 yr. In recent years, the rate of
uptake has been 1.9 ± 0.4 Ptg/ yr. Over the past 200 yr, the land has been a source of CO 2 to
the atmosphere (39 Ptg), while in recent years it has become a sink (–15 Ptg). This uptake of
CO 2 by terrestrial plants may be related to the regrowth of trees in North America. We are
not certain if this trend will continue in the future.
At the present time, most CO 2 studies are part of the CLIVAR program. The cruise tracts
in the world oceans presently being studied are shown in Figure 7.50. A number of countries are participating in the program. The recent studies by Sabine et al. (2008) demonstrate how the repeat measurements can be used to examine the changes of CO 2 over time.
The study examines the change in two cruise tracts (P2, east- west and P16, north- south) in
the Pacific Ocean (Figure 7.51). The TCO 2 values at the two sites are shown in Figure 7.52.
40E 80E 120E 160E 160W 120W 80W 40W
40E 80E 120E 160E 160W 120W 80W 40W
0°
0°
80S
80S
80N
40S
40N
80N
40S
40N
0°
0°
Figure 7.48
The cruise tracks occupied during the WOCE cruises. NOAA, National Oceanic and Atmospheric Administration.