

309
The Carbonate System
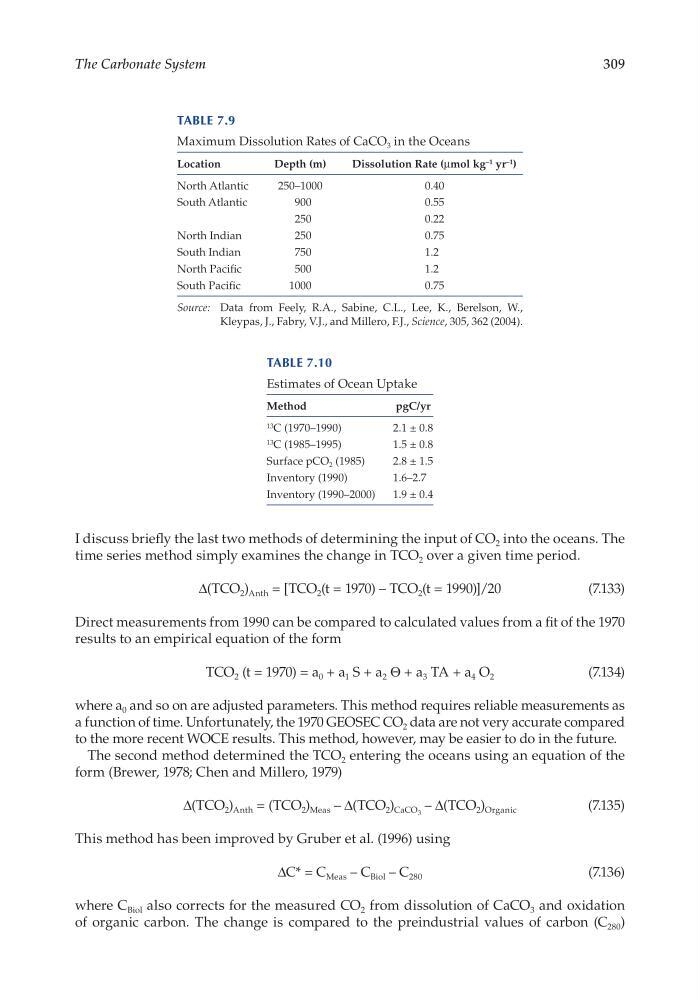
I discuss briefly the last two methods of determining the input of CO 2 into the oceans. The
time series method simply examines the change in TCO 2 over a given time period.
Δ(TCO 2 ) Anth = [TCO 2 (t = 1970) – TCO 2 (t = 1990)]/20
(7.133)
Direct measurements from 1990 can be compared to calculated values from a fit of the 1970
results to an empirical equation of the form
TCO 2 (t = 1970) = a 0 + a 1 S + a 2 Θ + a 3 TA + a 4 O 2
(7.134)
where a 0 and so on are adjusted parameters. This method requires reliable measurements as
a function of time. Unfortunately, the 1970 GEOSEC CO 2 data are not very accurate compared
to the more recent WOCE results. This method, however, may be easier to do in the future.
The second method determined the TCO 2 entering the oceans using an equation of the
form (Brewer, 1978; Chen and Millero, 1979)
Δ(TCO 2 ) Anth = (TCO 2 ) Meas – Δ(TCO 2 ) CaCO 3 – Δ(TCO 2 ) Organic
(7.135)
This method has been improved by Gruber et al. (1996) using
ΔC* = C Meas – C Biol – C 280
(7.136)
where C Biol also corrects for the measured CO 2 from dissolution of CaCO 3 and oxidation
of organic carbon. The change is compared to the preindustrial values of carbon (C 280 )
Table 7.9
Maximum Dissolution Rates of CaCO 3 in the Oceans
Location
Depth (m)
Dissolution Rate (μmol kg –1 yr –1 )
North Atlantic
250–1000
0.40
South Atlantic
900
0.55
250
0.22
North Indian
250
0.75
South Indian
750
1.2
North Pacific
500
1.2
South Pacific
1000
0.75
Source: Data from Feely, R.A., Sabine, C.L., Lee, K., Berelson, W.,
Kleypas, J., Fabry, V.J., and Millero, F.J., Science, 305, 362 (2004).
Table 7.10
Estimates of Ocean Uptake
Method
pgC/ yr
13 C (1970–1990)
2.1 ± 0.8
13 C (1985–1995)
1.5 ± 0.8
Surface pCO 2 (1985)
2.8 ± 1.5
Inventory (1990)
1.6–2.7
Inventory (1990–2000)
1.9 ± 0.4
The Carbonate System
I discuss briefly the last two methods of determining the input of CO 2 into the oceans. The
time series method simply examines the change in TCO 2 over a given time period.
Δ(TCO 2 ) Anth = [TCO 2 (t = 1970) – TCO 2 (t = 1990)]/20
(7.133)
Direct measurements from 1990 can be compared to calculated values from a fit of the 1970
results to an empirical equation of the form
TCO 2 (t = 1970) = a 0 + a 1 S + a 2 Θ + a 3 TA + a 4 O 2
(7.134)
where a 0 and so on are adjusted parameters. This method requires reliable measurements as
a function of time. Unfortunately, the 1970 GEOSEC CO 2 data are not very accurate compared
to the more recent WOCE results. This method, however, may be easier to do in the future.
The second method determined the TCO 2 entering the oceans using an equation of the
form (Brewer, 1978; Chen and Millero, 1979)
Δ(TCO 2 ) Anth = (TCO 2 ) Meas – Δ(TCO 2 ) CaCO 3 – Δ(TCO 2 ) Organic
(7.135)
This method has been improved by Gruber et al. (1996) using
ΔC* = C Meas – C Biol – C 280
(7.136)
where C Biol also corrects for the measured CO 2 from dissolution of CaCO 3 and oxidation
of organic carbon. The change is compared to the preindustrial values of carbon (C 280 )
Table 7.9
Maximum Dissolution Rates of CaCO 3 in the Oceans
Location
Depth (m)
Dissolution Rate (μmol kg –1 yr –1 )
North Atlantic
250–1000
0.40
South Atlantic
900
0.55
250
0.22
North Indian
250
0.75
South Indian
750
1.2
North Pacific
500
1.2
South Pacific
1000
0.75
Source: Data from Feely, R.A., Sabine, C.L., Lee, K., Berelson, W.,
Kleypas, J., Fabry, V.J., and Millero, F.J., Science, 305, 362 (2004).
Table 7.10
Estimates of Ocean Uptake
Method
pgC/ yr
13 C (1970–1990)
2.1 ± 0.8
13 C (1985–1995)
1.5 ± 0.8
Surface pCO 2 (1985)
2.8 ± 1.5
Inventory (1990)
1.6–2.7
Inventory (1990–2000)
1.9 ± 0.4