

285
The Carbonate System
does not change significantly in these waters. The TCO 2 increases by 0.68 and 1.26 μmol
kg –1 yr –1 and the δ 13 C decreases by 0.024 and 027 ppm yr –1 , respectively, at the Bermuda and
Hawaii time series stations.
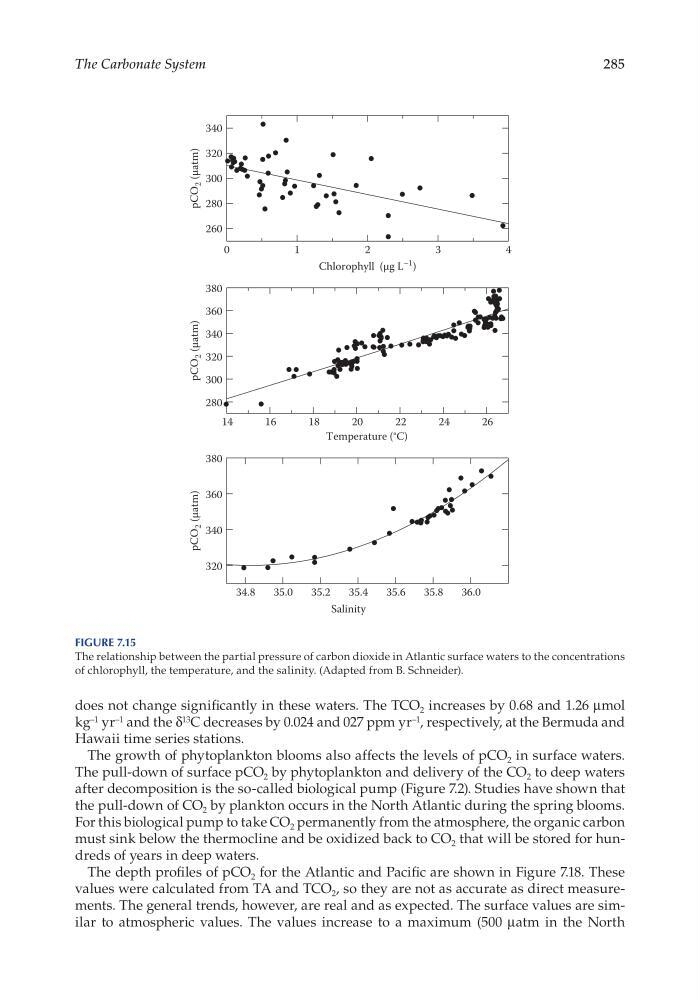
The growth of phytoplankton blooms also affects the levels of pCO 2 in surface waters.
The pull- down of surface pCO 2 by phytoplankton and delivery of the CO 2 to deep waters
after decomposition is the so- called biological pump (Figure 7.2). Studies have shown that
the pull- down of CO 2 by plankton occurs in the North Atlantic during the spring blooms.
For this biological pump to take CO 2 permanently from the atmosphere, the organic carbon
must sink below the thermocline and be oxidized back to CO 2 that will be stored for hundreds of years in deep waters.
The depth profiles of pCO 2 for the Atlantic and Pacific are shown in Figure 7.18. These
values were calculated from TA and TCO 2 , so they are not as accurate as direct measurements. The general trends, however, are real and as expected. The surface values are similar to atmospheric values. The values increase to a maximum (500 μatm in the North
Chlorophyll (µg L
–1 )
0
1
2
3
4
260
280
300
320
340
Temperature (°C)
14
16
18
20
22
24
26
280
300
320
340
360
380
Salinity
34.8
35.0
35.2
35.4
35.6
35.8
36.0
320
340
360
380
pCO
2 (µatm)
pCO
2 (µatm)
pCO
2 (µatm)
Figure 7.15
The relationship between the partial pressure of carbon dioxide in Atlantic surface waters to the concentrations
of chlorophyll, the temperature, and the salinity. (Adapted from B. Schneider).
The Carbonate System
does not change significantly in these waters. The TCO 2 increases by 0.68 and 1.26 μmol
kg –1 yr –1 and the δ 13 C decreases by 0.024 and 027 ppm yr –1 , respectively, at the Bermuda and
Hawaii time series stations.
The growth of phytoplankton blooms also affects the levels of pCO 2 in surface waters.
The pull- down of surface pCO 2 by phytoplankton and delivery of the CO 2 to deep waters
after decomposition is the so- called biological pump (Figure 7.2). Studies have shown that
the pull- down of CO 2 by plankton occurs in the North Atlantic during the spring blooms.
For this biological pump to take CO 2 permanently from the atmosphere, the organic carbon
must sink below the thermocline and be oxidized back to CO 2 that will be stored for hundreds of years in deep waters.
The depth profiles of pCO 2 for the Atlantic and Pacific are shown in Figure 7.18. These
values were calculated from TA and TCO 2 , so they are not as accurate as direct measurements. The general trends, however, are real and as expected. The surface values are similar to atmospheric values. The values increase to a maximum (500 μatm in the North
Chlorophyll (µg L
–1 )
0
1
2
3
4
260
280
300
320
340
Temperature (°C)
14
16
18
20
22
24
26
280
300
320
340
360
380
Salinity
34.8
35.0
35.2
35.4
35.6
35.8
36.0
320
340
360
380
pCO
2 (µatm)
pCO
2 (µatm)
pCO
2 (µatm)
Figure 7.15
The relationship between the partial pressure of carbon dioxide in Atlantic surface waters to the concentrations
of chlorophyll, the temperature, and the salinity. (Adapted from B. Schneider).