

284
Chemical Oceanography, 4th Edition
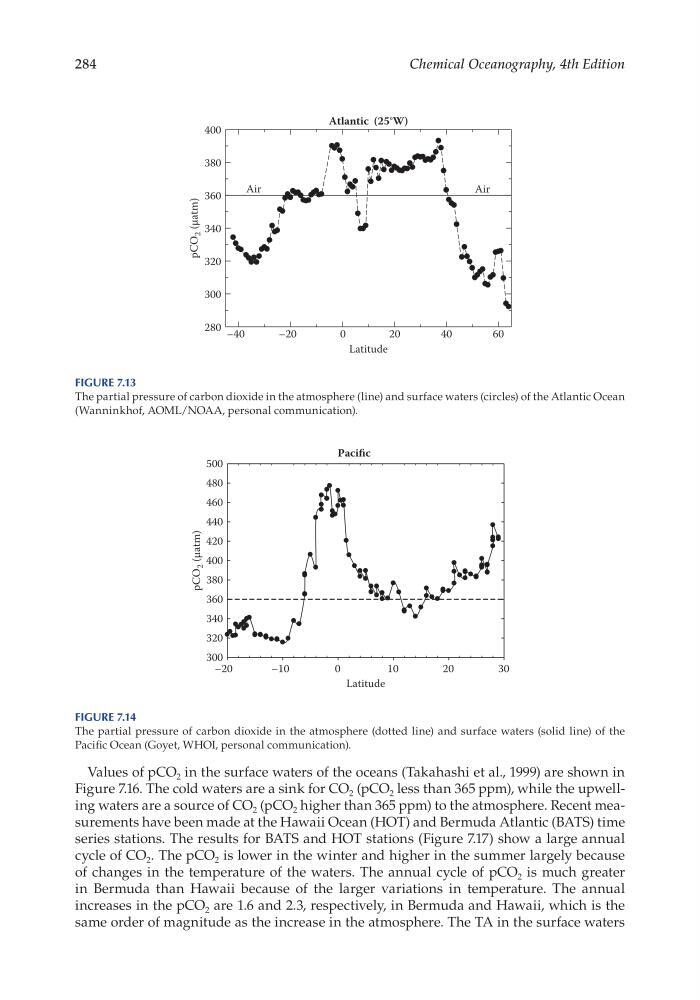
Values of pCO 2 in the surface waters of the oceans (Takahashi et al., 1999) are shown in
Figure 7.16. The cold waters are a sink for CO 2 (pCO 2 less than 365 ppm), while the upwelling waters are a source of CO 2 (pCO 2 higher than 365 ppm) to the atmosphere. Recent measurements have been made at the Hawaii Ocean (HOT) and Bermuda Atlantic (BATS) time
series stations. The results for BATS and HOT stations (Figure 7.17) show a large annual
cycle of CO 2 . The pCO 2 is lower in the winter and higher in the summer largely because
of changes in the temperature of the waters. The annual cycle of pCO 2 is much greater
in Bermuda than Hawaii because of the larger variations in temperature. The annual
increases in the pCO 2 are 1.6 and 2.3, respectively, in Bermuda and Hawaii, which is the
same order of magnitude as the increase in the atmosphere. The TA in the surface waters
Pacific
Latitude
–20
–10
0
10
20
30
300
320
340
360
380
400
420
440
460
480
500
pCO
2 (µatm)
Figure 7.14
The partial pressure of carbon dioxide in the atmosphere (dotted line) and surface waters (solid line) of the
Pacific Ocean (Goyet, WHOI, personal communication).
Atlantic (25°W)
Latitude
–40
–20
0
20
40
60
pCO
2 (µatm)
280
300
320
340
360
380
400
Air
Air
Figure 7.13
The partial pressure of carbon dioxide in the atmosphere (line) and surface waters (circles) of the Atlantic Ocean
(Wanninkhof, AOML/ NOAA, personal communication).
Chemical Oceanography, 4th Edition
Values of pCO 2 in the surface waters of the oceans (Takahashi et al., 1999) are shown in
Figure 7.16. The cold waters are a sink for CO 2 (pCO 2 less than 365 ppm), while the upwelling waters are a source of CO 2 (pCO 2 higher than 365 ppm) to the atmosphere. Recent measurements have been made at the Hawaii Ocean (HOT) and Bermuda Atlantic (BATS) time
series stations. The results for BATS and HOT stations (Figure 7.17) show a large annual
cycle of CO 2 . The pCO 2 is lower in the winter and higher in the summer largely because
of changes in the temperature of the waters. The annual cycle of pCO 2 is much greater
in Bermuda than Hawaii because of the larger variations in temperature. The annual
increases in the pCO 2 are 1.6 and 2.3, respectively, in Bermuda and Hawaii, which is the
same order of magnitude as the increase in the atmosphere. The TA in the surface waters
Pacific
Latitude
–20
–10
0
10
20
30
300
320
340
360
380
400
420
440
460
480
500
pCO
2 (µatm)
Figure 7.14
The partial pressure of carbon dioxide in the atmosphere (dotted line) and surface waters (solid line) of the
Pacific Ocean (Goyet, WHOI, personal communication).
Atlantic (25°W)
Latitude
–40
–20
0
20
40
60
pCO
2 (µatm)
280
300
320
340
360
380
400
Air
Air
Figure 7.13
The partial pressure of carbon dioxide in the atmosphere (line) and surface waters (circles) of the Atlantic Ocean
(Wanninkhof, AOML/ NOAA, personal communication).