

206
Chemical Oceanography, 4th Edition
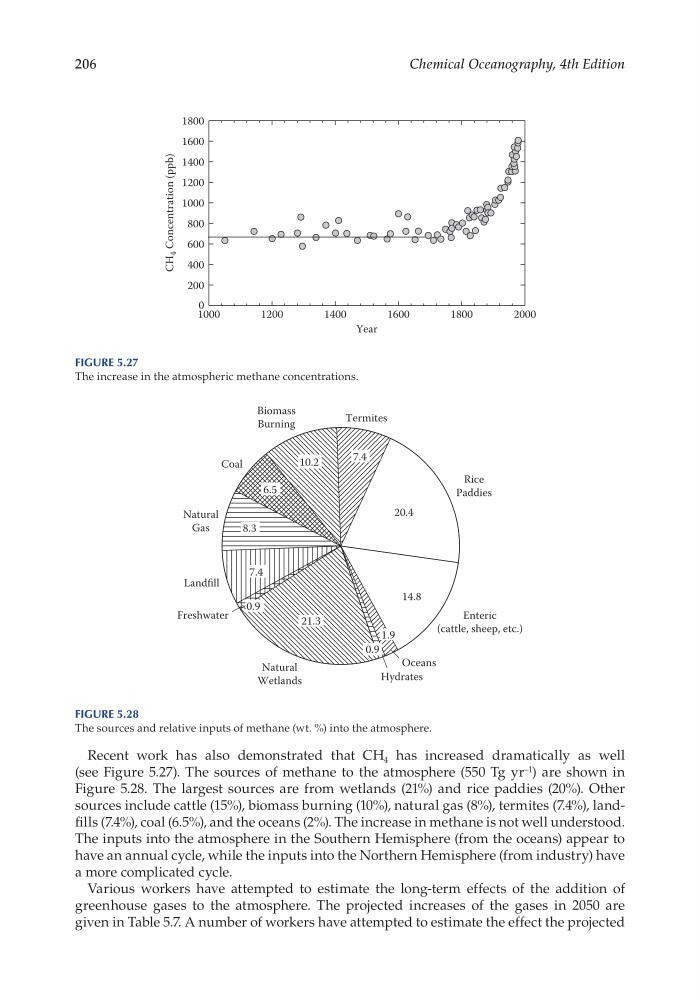
Recent work has also demonstrated that CH 4 has increased dramatically as well
(see Figure 5.27). The sources of methane to the atmosphere (550 Tg yr –1 ) are shown in
Figure 5.28. The largest sources are from wetlands (21%) and rice paddies (20%). Other
sources include cattle (15%), biomass burning (10%), natural gas (8%), termites (7.4%), landfills (7.4%), coal (6.5%), and the oceans (2%). The increase in methane is not well understood.
The inputs into the atmosphere in the Southern Hemisphere (from the oceans) appear to
have an annual cycle, while the inputs into the Northern Hemisphere (from industry) have
a more complicated cycle.
Various workers have attempted to estimate the long- term effects of the addition of
greenhouse gases to the atmosphere. The projected increases of the gases in 2050 are
given in Table 5.7. A number of workers have attempted to estimate the effect the projected
Year
1000
1200
1400
1600
1800
2000
CH
4 Concentration (ppb)
0
200
400
600
800
1000
1200
1400
1600
1800
Figure 5.27
The increase in the atmospheric methane concentrations.
7.4
Rice
Paddies
Termites
Biomass
Burning
Coal
Natural
Gas
Landfill
Freshwater
Natural
Wetlands
Hydrates
Oceans
Enteric
(cattle, sheep, etc.)
14.8
1.9
0.9
0.9
7.4
8.3
10.2
6.5
20.4
21.3
Figure 5.28
The sources and relative inputs of methane (wt. %) into the atmosphere.
Chemical Oceanography, 4th Edition
Recent work has also demonstrated that CH 4 has increased dramatically as well
(see Figure 5.27). The sources of methane to the atmosphere (550 Tg yr –1 ) are shown in
Figure 5.28. The largest sources are from wetlands (21%) and rice paddies (20%). Other
sources include cattle (15%), biomass burning (10%), natural gas (8%), termites (7.4%), landfills (7.4%), coal (6.5%), and the oceans (2%). The increase in methane is not well understood.
The inputs into the atmosphere in the Southern Hemisphere (from the oceans) appear to
have an annual cycle, while the inputs into the Northern Hemisphere (from industry) have
a more complicated cycle.
Various workers have attempted to estimate the long- term effects of the addition of
greenhouse gases to the atmosphere. The projected increases of the gases in 2050 are
given in Table 5.7. A number of workers have attempted to estimate the effect the projected
Year
1000
1200
1400
1600
1800
2000
CH
4 Concentration (ppb)
0
200
400
600
800
1000
1200
1400
1600
1800
Figure 5.27
The increase in the atmospheric methane concentrations.
7.4
Rice
Paddies
Termites
Biomass
Burning
Coal
Natural
Gas
Landfill
Freshwater
Natural
Wetlands
Hydrates
Oceans
Enteric
(cattle, sheep, etc.)
14.8
1.9
0.9
0.9
7.4
8.3
10.2
6.5
20.4
21.3
Figure 5.28
The sources and relative inputs of methane (wt. %) into the atmosphere.