

203
Atmospheric Chemistry
concentration of CO 2 in the atmosphere in the past has been determined by measuring
the concentration of CO 2 in the air trapped in ice cores (Figure 5.19, squares). The extension of the pCO 2 record back 10,000 years shows that the level of CO 2 in the atmosphere
has increased and decreased through time. The levels are lower during glacial times and
higher during nonglacial times. These increases and decreases in CO 2 have followed the
global temperatures (Figure 5.26). We do not know if the fluctuations in CO 2 caused the
changes in the temperature or vice versa.
Europe
Asia
USA
Metric Tons
0
200
400
600
800
1000
1200
1400
1600
1800
1980
2000
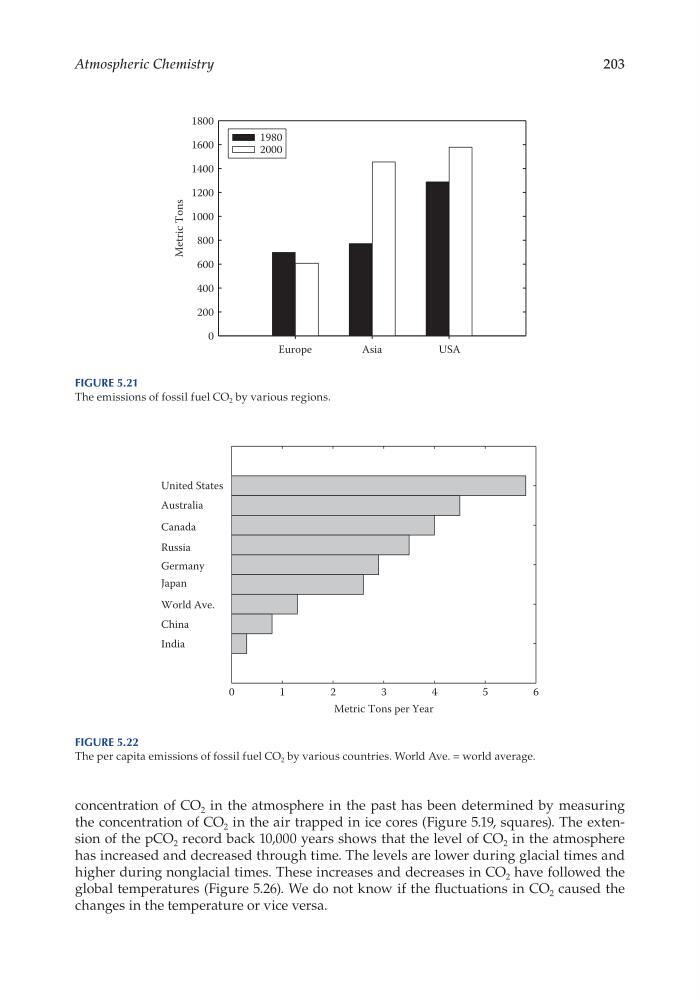
Figure 5.21
The emissions of fossil fuel CO 2 by various regions.
Metric Tons per Year
0
1
2
3
4
5
6
United States
Australia
Canada
Russia
Germany
Japan
World Ave.
China
India
Figure 5.22
The per capita emissions of fossil fuel CO 2 by various countries. World Ave. = world average.
Atmospheric Chemistry
concentration of CO 2 in the atmosphere in the past has been determined by measuring
the concentration of CO 2 in the air trapped in ice cores (Figure 5.19, squares). The extension of the pCO 2 record back 10,000 years shows that the level of CO 2 in the atmosphere
has increased and decreased through time. The levels are lower during glacial times and
higher during nonglacial times. These increases and decreases in CO 2 have followed the
global temperatures (Figure 5.26). We do not know if the fluctuations in CO 2 caused the
changes in the temperature or vice versa.
Europe
Asia
USA
Metric Tons
0
200
400
600
800
1000
1200
1400
1600
1800
1980
2000
Figure 5.21
The emissions of fossil fuel CO 2 by various regions.
Metric Tons per Year
0
1
2
3
4
5
6
United States
Australia
Canada
Russia
Germany
Japan
World Ave.
China
India
Figure 5.22
The per capita emissions of fossil fuel CO 2 by various countries. World Ave. = world average.