

202
Chemical Oceanography, 4th Edition
The measurements of the pCO 2 in the atmosphere by Keeling and Whorf (2004) starting in 1958 at the Mauna Loa Observatory in Hawaii demonstrated that CO 2 is increasing
(Figure 5.23). The annual cycling of pCO 2 in the atmosphere shown after the removal
of the increases (Figure 5.24) is caused by variations in the photosynthesis and respiration of land plants. The maximum occurs in April and May, and the minimum occurs
in September and October. In recent years, the values of pCO 2 have been measured at
other locations (Figure 5.25). The increases were the same (1.5 ppm/ year) as at Mauna
Loa, but the yearly variations were larger in Alaska and smaller in the South Pole. The
Year
1720
1760
1800
1840
1880
1920
1960
2000
pCO
2 (ppm)
270
280
290
300
310
320
330
340
350
360
370
380
390
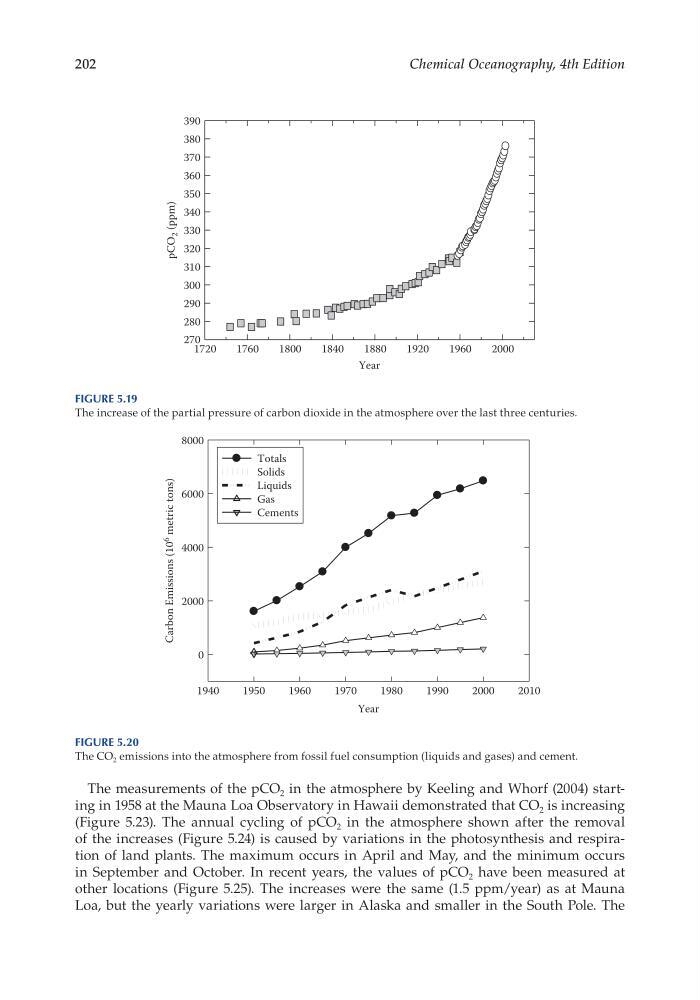
Figure 5.19
The increase of the partial pressure of carbon dioxide in the atmosphere over the last three centuries.
Year
1940
1950
1960
1970
1980
1990
2000
2010
Carbon Emissions (10
6
metric tons)
0
2000
4000
6000
8000
Totals
Solids
Liquids
Gas
Cements
Figure 5.20
The CO 2 emissions into the atmosphere from fossil fuel consumption (liquids and gases) and cement.
Chemical Oceanography, 4th Edition
The measurements of the pCO 2 in the atmosphere by Keeling and Whorf (2004) starting in 1958 at the Mauna Loa Observatory in Hawaii demonstrated that CO 2 is increasing
(Figure 5.23). The annual cycling of pCO 2 in the atmosphere shown after the removal
of the increases (Figure 5.24) is caused by variations in the photosynthesis and respiration of land plants. The maximum occurs in April and May, and the minimum occurs
in September and October. In recent years, the values of pCO 2 have been measured at
other locations (Figure 5.25). The increases were the same (1.5 ppm/ year) as at Mauna
Loa, but the yearly variations were larger in Alaska and smaller in the South Pole. The
Year
1720
1760
1800
1840
1880
1920
1960
2000
pCO
2 (ppm)
270
280
290
300
310
320
330
340
350
360
370
380
390
Figure 5.19
The increase of the partial pressure of carbon dioxide in the atmosphere over the last three centuries.
Year
1940
1950
1960
1970
1980
1990
2000
2010
Carbon Emissions (10
6
metric tons)
0
2000
4000
6000
8000
Totals
Solids
Liquids
Gas
Cements
Figure 5.20
The CO 2 emissions into the atmosphere from fossil fuel consumption (liquids and gases) and cement.