

174
Chemical Oceanography, 4th Edition
The correction for ion pairs is simple to make. For example, for H + the desired γ T is given by
γ
γ
β
T
F
HSO SO
=
+
−
(
[
])
1
4
4
1
(4.89)
where γ F is the value for all the anions except SO 4
2− . Using β HSO4 = 12.0, one obtains
γ T =
+
×
=
0 739 1 12 0 0 02947 0 546
. (
.
.
) .
(4.90)
The reliability of the Pitzer- generated activity coefficients can be demonstrated by calculating the K 2 * for carbonic acid in seawater. The value is given by
K K HCO
H CO
2
2
10 33
3
3
10
0 556 0 546 0 03
*
.
.
.
.
γ
γ γ
/
/
=
×
×
−
9 9 10
8 91
=
− .
(4.91)
This calculated value can be compared to the measured value of pK 2
* = 8.93.
The major advantage of the Pitzer (1991) equations is that they can be used over a wide
range of compositions and ionic strengths without iterations. The equations can be used
to estimate the free activity coefficients of minor cations and anions needed to use the ionpairing model that must be considered for strong interactions (such as metal–OH– interactions). Attempts have been made (Millero, 1992) to combine the Pitzer specific interaction
and ion- pairing model to determine the speciation and activity coefficients of metals in
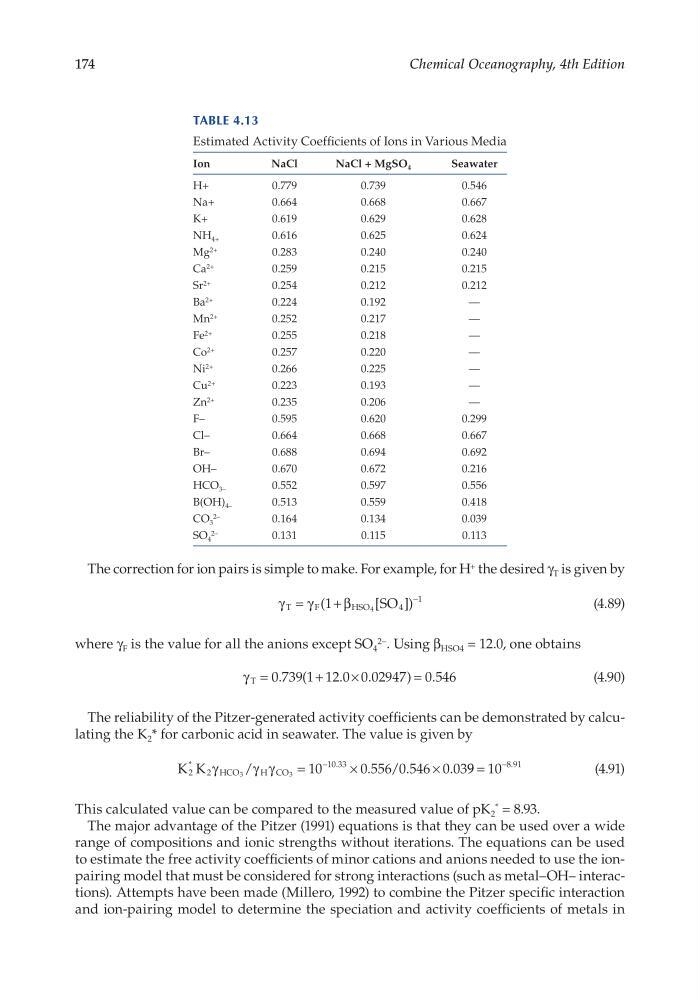
Table 4.13
Estimated Activity Coefficients of Ions in Various Media
Ion
NaCl
NaCl + MgSO 4
Seawater
H+
0.779
0.739
0.546
Na+
0.664
0.668
0.667
K+
0.619
0.629
0.628
NH 4+
0.616
0.625
0.624
Mg 2+
0.283
0.240
0.240
Ca 2+
0.259
0.215
0.215
Sr 2+
0.254
0.212
0.212
Ba 2+
0.224
0.192
—
Mn 2+
0.252
0.217
—
Fe 2+
0.255
0.218
—
Co 2+
0.257
0.220
—
Ni 2+
0.266
0.225
—
Cu 2+
0.223
0.193
—
Zn 2+
0.235
0.206
—
F–
0.595
0.620
0.299
Cl–
0.664
0.668
0.667
Br–
0.688
0.694
0.692
OH–
0.670
0.672
0.216
HCO 3–
0.552
0.597
0.556
B(OH) 4–
0.513
0.559
0.418
CO 3
2–
0.164
0.134
0.039
SO 4
2–
0.131
0.115
0.113
Chemical Oceanography, 4th Edition
The correction for ion pairs is simple to make. For example, for H + the desired γ T is given by
γ
γ
β
T
F
HSO SO
=
+
−
(
[
])
1
4
4
1
(4.89)
where γ F is the value for all the anions except SO 4
2− . Using β HSO4 = 12.0, one obtains
γ T =
+
×
=
0 739 1 12 0 0 02947 0 546
. (
.
.
) .
(4.90)
The reliability of the Pitzer- generated activity coefficients can be demonstrated by calculating the K 2 * for carbonic acid in seawater. The value is given by
K K HCO
H CO
2
2
10 33
3
3
10
0 556 0 546 0 03
*
.
.
.
.
γ
γ γ
/
/
=
×
×
−
9 9 10
8 91
=
− .
(4.91)
This calculated value can be compared to the measured value of pK 2
* = 8.93.
The major advantage of the Pitzer (1991) equations is that they can be used over a wide
range of compositions and ionic strengths without iterations. The equations can be used
to estimate the free activity coefficients of minor cations and anions needed to use the ionpairing model that must be considered for strong interactions (such as metal–OH– interactions). Attempts have been made (Millero, 1992) to combine the Pitzer specific interaction
and ion- pairing model to determine the speciation and activity coefficients of metals in
Table 4.13
Estimated Activity Coefficients of Ions in Various Media
Ion
NaCl
NaCl + MgSO 4
Seawater
H+
0.779
0.739
0.546
Na+
0.664
0.668
0.667
K+
0.619
0.629
0.628
NH 4+
0.616
0.625
0.624
Mg 2+
0.283
0.240
0.240
Ca 2+
0.259
0.215
0.215
Sr 2+
0.254
0.212
0.212
Ba 2+
0.224
0.192
—
Mn 2+
0.252
0.217
—
Fe 2+
0.255
0.218
—
Co 2+
0.257
0.220
—
Ni 2+
0.266
0.225
—
Cu 2+
0.223
0.193
—
Zn 2+
0.235
0.206
—
F–
0.595
0.620
0.299
Cl–
0.664
0.668
0.667
Br–
0.688
0.694
0.692
OH–
0.670
0.672
0.216
HCO 3–
0.552
0.597
0.556
B(OH) 4–
0.513
0.559
0.418
CO 3
2–
0.164
0.134
0.039
SO 4
2–
0.131
0.115
0.113