

146
Chemical Oceanography, 4th Edition
The continuum model (Figure 4.13) is an example of a crude model that can serve as
an approximation for the real system. Drude and Nernst (1884) first used this model to
explain the decrease in volume that occurs when an electrolyte is dissolved in water. Born
(1920) popularized the model, and his name is normally attached to its use. In the model,
an ion is pictured as a solid sphere of radius r bearing a charge Ze (where Z is the valence
and e is the electrostatic charge), and the solvent is a structureless continuous dielectric
medium. Using electrostatics, the ΔG h
o (in units of kcal mol –1 ) is given by (at 25°C)
ΔG h
o = –(Ne 2 Z 2 /2r)(1 – 1/D) = –163.89 Z 2 /r
(4.16)
where N is Avogadro’s number, r is the radius in angstrom units (1 Å = 1 × 10 −8 cm),
and D is the dielectric constant of water (78.36 at 25°C). By appropriate differentiation of
Equation 4.16 with respect to temperature T, it is possible to determine the other thermodynamic hydration functions ΔS h
o (in units of calories degree –1 mol –1 ) and ΔH h
o (in units
of kilocalories mol –1 ):
ΔS h
o = (Ne 2 Z 2 /2r)(∂lnD/∂T) P = –9.649 Z 2 /r
(4.17)
ΔH h
o = (–Ne 2 Z 2 /2r)[1 – 1/D – (T/ D)(∂lnD/∂T) P ] = –166.78 Z 2 /r
(4.18)
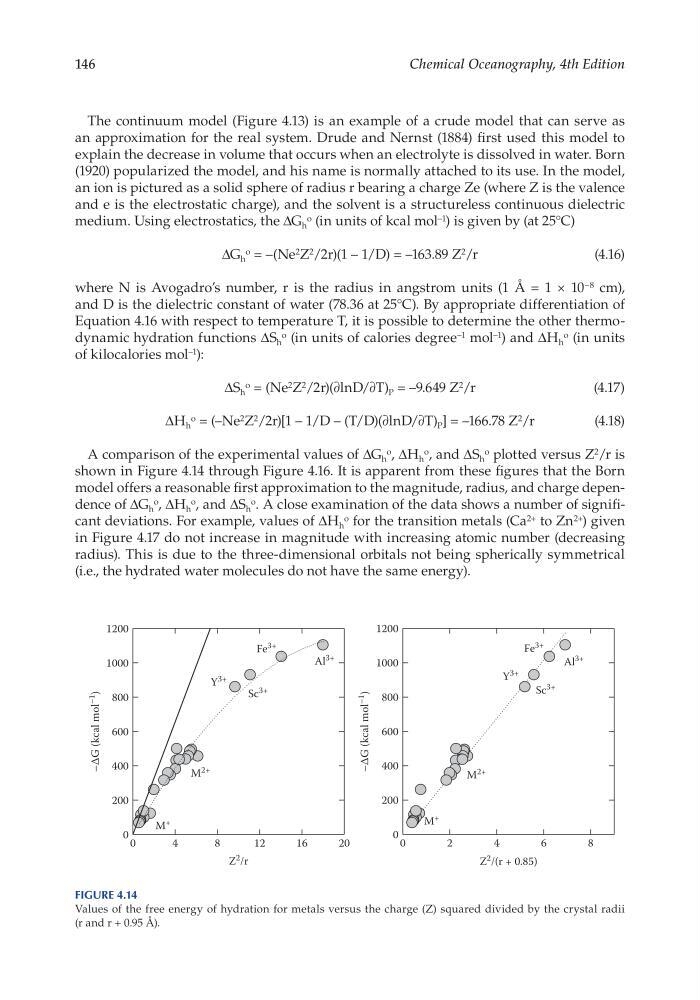
A comparison of the experimental values of ΔG h
o , ΔH h
o , and ΔS h
o plotted versus Z 2 /r is
shown in Figure 4.14 through Figure 4.16. It is apparent from these figures that the Born
model offers a reasonable first approximation to the magnitude, radius, and charge dependence of ΔG h
o , ΔH h
o , and ΔS h
o . A close examination of the data shows a number of significant deviations. For example, values of ΔH h
o for the transition metals (Ca 2+ to Zn 2+ ) given
in Figure 4.17 do not increase in magnitude with increasing atomic number (decreasing
radius). This is due to the three- dimensional orbitals not being spherically symmetrical
(i.e., the hydrated water molecules do not have the same energy).
Z
2 /r
0
4
8
12
16
20
–∆G (kcal mol
–1
)
0
200
400
600
800
1000
1200
Al
3+
Fe
3+
Sc
3+
Y
3+
M
2+
M
+
Z
2 /(r + 0.85)
0
2
4
6
8
–∆G (kcal mol
–1
)
0
200
400
600
800
1000
1200
M
+
M
2+
Y
3+
Sc
3+
Fe
3+
Al
3+
Figure 4.14
Values of the free energy of hydration for metals versus the charge (Z) squared divided by the crystal radii
(r and r + 0.95 Å).
Chemical Oceanography, 4th Edition
The continuum model (Figure 4.13) is an example of a crude model that can serve as
an approximation for the real system. Drude and Nernst (1884) first used this model to
explain the decrease in volume that occurs when an electrolyte is dissolved in water. Born
(1920) popularized the model, and his name is normally attached to its use. In the model,
an ion is pictured as a solid sphere of radius r bearing a charge Ze (where Z is the valence
and e is the electrostatic charge), and the solvent is a structureless continuous dielectric
medium. Using electrostatics, the ΔG h
o (in units of kcal mol –1 ) is given by (at 25°C)
ΔG h
o = –(Ne 2 Z 2 /2r)(1 – 1/D) = –163.89 Z 2 /r
(4.16)
where N is Avogadro’s number, r is the radius in angstrom units (1 Å = 1 × 10 −8 cm),
and D is the dielectric constant of water (78.36 at 25°C). By appropriate differentiation of
Equation 4.16 with respect to temperature T, it is possible to determine the other thermodynamic hydration functions ΔS h
o (in units of calories degree –1 mol –1 ) and ΔH h
o (in units
of kilocalories mol –1 ):
ΔS h
o = (Ne 2 Z 2 /2r)(∂lnD/∂T) P = –9.649 Z 2 /r
(4.17)
ΔH h
o = (–Ne 2 Z 2 /2r)[1 – 1/D – (T/ D)(∂lnD/∂T) P ] = –166.78 Z 2 /r
(4.18)
A comparison of the experimental values of ΔG h
o , ΔH h
o , and ΔS h
o plotted versus Z 2 /r is
shown in Figure 4.14 through Figure 4.16. It is apparent from these figures that the Born
model offers a reasonable first approximation to the magnitude, radius, and charge dependence of ΔG h
o , ΔH h
o , and ΔS h
o . A close examination of the data shows a number of significant deviations. For example, values of ΔH h
o for the transition metals (Ca 2+ to Zn 2+ ) given
in Figure 4.17 do not increase in magnitude with increasing atomic number (decreasing
radius). This is due to the three- dimensional orbitals not being spherically symmetrical
(i.e., the hydrated water molecules do not have the same energy).
Z
2 /r
0
4
8
12
16
20
–∆G (kcal mol
–1
)
0
200
400
600
800
1000
1200
Al
3+
Fe
3+
Sc
3+
Y
3+
M
2+
M
+
Z
2 /(r + 0.85)
0
2
4
6
8
–∆G (kcal mol
–1
)
0
200
400
600
800
1000
1200
M
+
M
2+
Y
3+
Sc
3+
Fe
3+
Al
3+
Figure 4.14
Values of the free energy of hydration for metals versus the charge (Z) squared divided by the crystal radii
(r and r + 0.95 Å).