

105
Minor Elements in Seawater
Mn, Fe, and Co (Figures 3.14, 3.15, and 3.16, respectively) are more complicated
than the other transition metals. The Mn is higher in surface waters but appears
to go through a maximum in the Pacific. The profiles of Fe and Co are low in
surface waters and go through a maximum in intermediate waters. The increase
of Mn and Fe near the O 2 minimum may be related to the formation of reduced
forms of these metals. The recent results of Biller and Bruland (2012) for copper are
shown in Figure 3.17. The surface values of Cu in the Atlantic and Pacific are similar and increase slowly in deeper waters. Cu does not appear to be directly related
to the soft or hard parts of plants. Over the next 10 years, some of these causes will
be elucidated as the GEOTRACES measurements continue.
3. Surface enrichment and depletion at depth: Elements of this type have a surface
input from the atmosphere, rivers, and land and are rapidly removed from seawater. The residence times of these elements are very short. The metal Pb is a good
example of an element entering the oceans via the atmosphere. The results off the
coast of Bermuda as a function of time are shown in Figure 3.18. The high surface
input of lead is largely the result of its past use as an antiknock agent in gasoline.
Over time, it is removed by precipitation or adsorption to particles (Wu and Boyle,
1997). The exact mechanism for the scavenging of lead is not well defined at present. It is interesting to note that the recent measurements of Pb in the Atlantic and
Pacific Oceans by Biller and Bruland (2012) are different from the earlier measurements (see Figure 3.19). The surface values of Pb are higher in the Pacific Ocean
than in the past. This may be due to the higher concentrations of Pb in dust in Asia
from the use of coal to produce electricity. The deep Atlantic and Pacific values
of Pb are lower due to the loss as the waters move from the Atlantic to the Pacific
Ocean as found in earlier studies.
Zn (nmol kg
–1 )
0
2
4
6
8
10
Depth (m)
0
1000
2000
3000
4000
5000
SiO 2 (mol kg
–1 )
0
50
100
150
200
0
1000
2000
3000
4000
5000
North
Atlantic
North
Pacific
North
Atlantic
North
Pacific
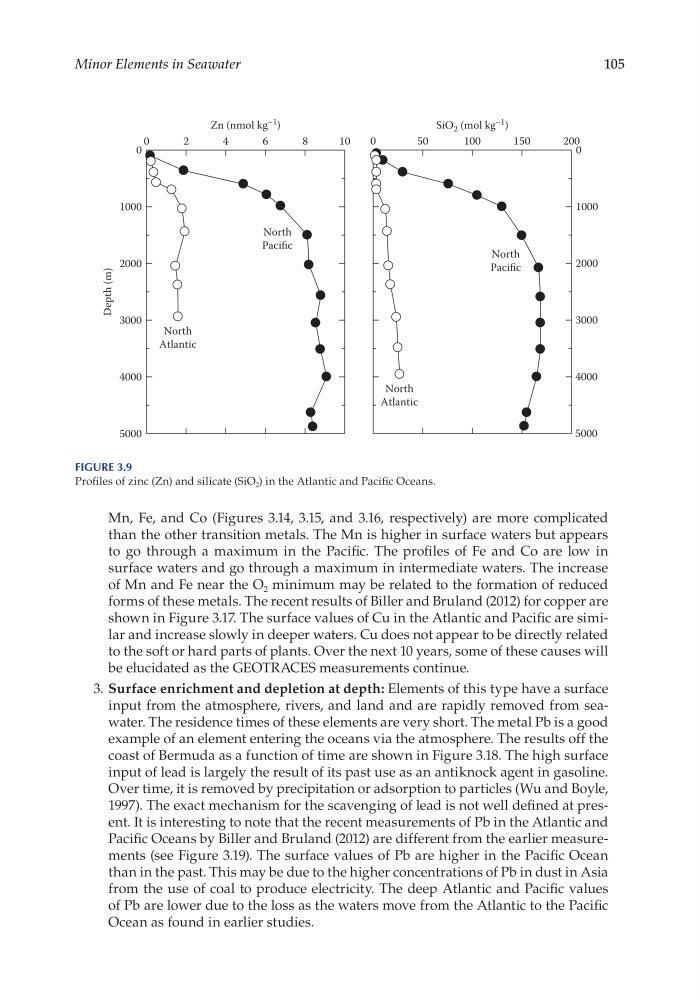
Figure 3.9
Profiles of zinc (Zn) and silicate (SiO 2 ) in the Atlantic and Pacific Oceans.
Minor Elements in Seawater
Mn, Fe, and Co (Figures 3.14, 3.15, and 3.16, respectively) are more complicated
than the other transition metals. The Mn is higher in surface waters but appears
to go through a maximum in the Pacific. The profiles of Fe and Co are low in
surface waters and go through a maximum in intermediate waters. The increase
of Mn and Fe near the O 2 minimum may be related to the formation of reduced
forms of these metals. The recent results of Biller and Bruland (2012) for copper are
shown in Figure 3.17. The surface values of Cu in the Atlantic and Pacific are similar and increase slowly in deeper waters. Cu does not appear to be directly related
to the soft or hard parts of plants. Over the next 10 years, some of these causes will
be elucidated as the GEOTRACES measurements continue.
3. Surface enrichment and depletion at depth: Elements of this type have a surface
input from the atmosphere, rivers, and land and are rapidly removed from seawater. The residence times of these elements are very short. The metal Pb is a good
example of an element entering the oceans via the atmosphere. The results off the
coast of Bermuda as a function of time are shown in Figure 3.18. The high surface
input of lead is largely the result of its past use as an antiknock agent in gasoline.
Over time, it is removed by precipitation or adsorption to particles (Wu and Boyle,
1997). The exact mechanism for the scavenging of lead is not well defined at present. It is interesting to note that the recent measurements of Pb in the Atlantic and
Pacific Oceans by Biller and Bruland (2012) are different from the earlier measurements (see Figure 3.19). The surface values of Pb are higher in the Pacific Ocean
than in the past. This may be due to the higher concentrations of Pb in dust in Asia
from the use of coal to produce electricity. The deep Atlantic and Pacific values
of Pb are lower due to the loss as the waters move from the Atlantic to the Pacific
Ocean as found in earlier studies.
Zn (nmol kg
–1 )
0
2
4
6
8
10
Depth (m)
0
1000
2000
3000
4000
5000
SiO 2 (mol kg
–1 )
0
50
100
150
200
0
1000
2000
3000
4000
5000
North
Atlantic
North
Pacific
North
Atlantic
North
Pacific
Figure 3.9
Profiles of zinc (Zn) and silicate (SiO 2 ) in the Atlantic and Pacific Oceans.