

suggest strong fluctuations on time scales of a few
months (Imawaki et al., 1997). Similar to the case
of the North Atlantic, the measurements appear at
odds with previous model suggestions of a wintertime maximum in response to the basin-scale wind
forcing (Sekine and Kutsuwada, 1994). Chelton
and Mestas-Nunez (1997) analyse results from a
version of the global model described by Dukowicz and Smith (1994) at a mean resolution of 1/6°,
forced by ECMWF wind stress fields, and demonstrate that the low-frequency variability of the
barotropic streamfunction is dominated by simple
time-varying Sverdrup response over large parts of
the basin. A stringent test of the model behaviour
is provided by comparison with SSH time series
from T/P observations (corrected for a steric
response to heating and cooling, and averaged spatially to remove effects of energetic Rossby wave
signals). Time series of model transport for areal
averages over the Oyashio, Kuroshio and Kuroshio
Extension are similar to those estimated from the
T/P data (Fig. 2.2.5). Higher correlations between
model and data than between model and simple
Sverdrup dynamics indicate the importance of
added model dynamics not considered in linear
Sverdrup dynamics.
The example again shows that quantitative tests
of model simulations concerning the response to
atmospheric fluctuations tend to be complicated by
the presence of stochastic fluctuations of large
amplitude. Because of the need for an averaging in
time or space to unravel the deterministic signals,
stringent tests comparable to the possibilities
offered by altimeter data are usually more difficult
if based on local time series, e.g. of boundary current transports. However, present evidence suggests
that the high levels of model skill with respect to
wind-driven variability are not restricted to nearsurface phenomena. For example, the annual and
semiannual variation in the transport of the Deep
Western Boundary Current in the equatorial
Atlantic, revealed by a synthesis of several yearlong current meter time series (Fischer and Schott,
1997), are quantitatively well reproduced in the
DYNAMO model simulations using wind stresses
based on ECMWF analyses (Fig. 2.2.6).
The recent demonstrations of model skill
concerning wind-driven variations in observable
quantities, such as boundary current transports,
obviously bear some implications for the models’
usefulness in understanding phenomena and
mechanisms less accessible to observations. A particularly important question is that of the representativeness of single hydrographic sections for
estimating ‘mean’ fluxes, e.g. of heat transport in
the ocean. Model studies have generally found an
annual cycle of heat transport with a similar phase
as obtained in observational estimates (e.g. Hsiung
et al., 1989). Inspection of various North Atlantic
models, including a suite of sensitivity experiments
carried out in the CME, indicated the wind forcing
to be the most decisive factor for the annual range
in the subtropics (Böning and Herrmann, 1994).
Very small model-to-model differences were also
found in the DYNAMO model intercomparison (Fig. 2.2.7), in strong contrast to the large
SECTION 2 OBSERVATIONS AND MODELS
68
(a)
(b)
Volume transport (Sv)
Volume transport (Sv)
Fig. 2.2.4 Annual cycle of volume transports in the
western North Atlantic at 26.5°N, east of the Bahamas,
from a 5.8-year record of moored transports (heavy
solid), and 5 years of a CME-model run. (a) Transports in
the upper 800 m, (b) transports below 800 m. From
Lee et al. (1996).
months (Imawaki et al., 1997). Similar to the case
of the North Atlantic, the measurements appear at
odds with previous model suggestions of a wintertime maximum in response to the basin-scale wind
forcing (Sekine and Kutsuwada, 1994). Chelton
and Mestas-Nunez (1997) analyse results from a
version of the global model described by Dukowicz and Smith (1994) at a mean resolution of 1/6°,
forced by ECMWF wind stress fields, and demonstrate that the low-frequency variability of the
barotropic streamfunction is dominated by simple
time-varying Sverdrup response over large parts of
the basin. A stringent test of the model behaviour
is provided by comparison with SSH time series
from T/P observations (corrected for a steric
response to heating and cooling, and averaged spatially to remove effects of energetic Rossby wave
signals). Time series of model transport for areal
averages over the Oyashio, Kuroshio and Kuroshio
Extension are similar to those estimated from the
T/P data (Fig. 2.2.5). Higher correlations between
model and data than between model and simple
Sverdrup dynamics indicate the importance of
added model dynamics not considered in linear
Sverdrup dynamics.
The example again shows that quantitative tests
of model simulations concerning the response to
atmospheric fluctuations tend to be complicated by
the presence of stochastic fluctuations of large
amplitude. Because of the need for an averaging in
time or space to unravel the deterministic signals,
stringent tests comparable to the possibilities
offered by altimeter data are usually more difficult
if based on local time series, e.g. of boundary current transports. However, present evidence suggests
that the high levels of model skill with respect to
wind-driven variability are not restricted to nearsurface phenomena. For example, the annual and
semiannual variation in the transport of the Deep
Western Boundary Current in the equatorial
Atlantic, revealed by a synthesis of several yearlong current meter time series (Fischer and Schott,
1997), are quantitatively well reproduced in the
DYNAMO model simulations using wind stresses
based on ECMWF analyses (Fig. 2.2.6).
The recent demonstrations of model skill
concerning wind-driven variations in observable
quantities, such as boundary current transports,
obviously bear some implications for the models’
usefulness in understanding phenomena and
mechanisms less accessible to observations. A particularly important question is that of the representativeness of single hydrographic sections for
estimating ‘mean’ fluxes, e.g. of heat transport in
the ocean. Model studies have generally found an
annual cycle of heat transport with a similar phase
as obtained in observational estimates (e.g. Hsiung
et al., 1989). Inspection of various North Atlantic
models, including a suite of sensitivity experiments
carried out in the CME, indicated the wind forcing
to be the most decisive factor for the annual range
in the subtropics (Böning and Herrmann, 1994).
Very small model-to-model differences were also
found in the DYNAMO model intercomparison (Fig. 2.2.7), in strong contrast to the large
SECTION 2 OBSERVATIONS AND MODELS
68
(a)
(b)
Volume transport (Sv)
Volume transport (Sv)
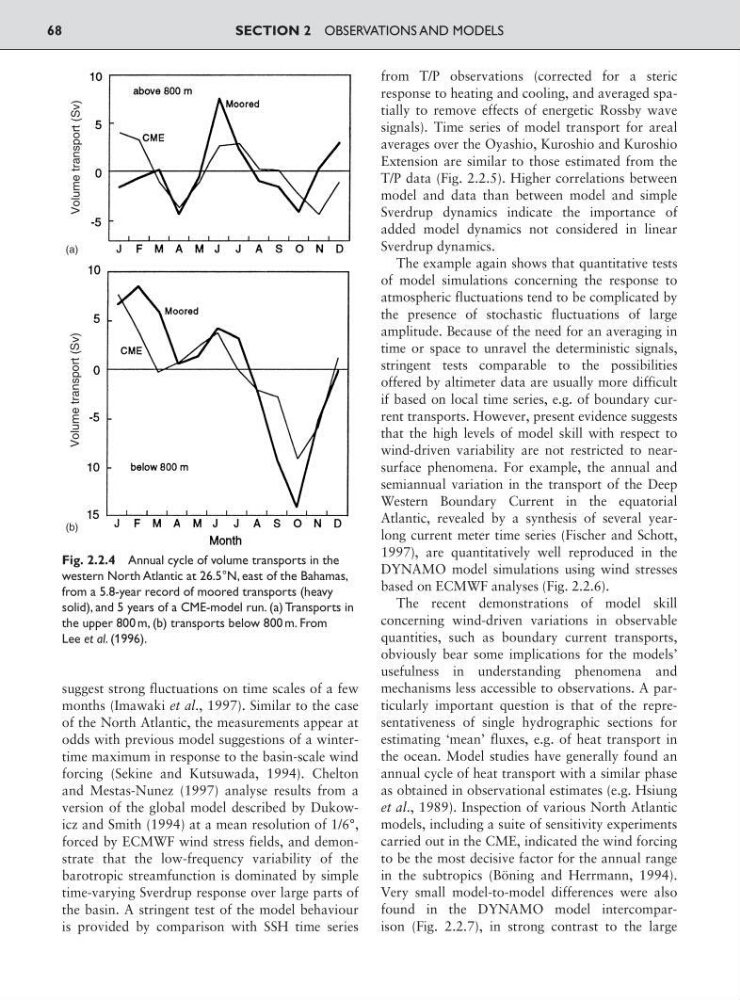
Fig. 2.2.4 Annual cycle of volume transports in the
western North Atlantic at 26.5°N, east of the Bahamas,
from a 5.8-year record of moored transports (heavy
solid), and 5 years of a CME-model run. (a) Transports in
the upper 800 m, (b) transports below 800 m. From
Lee et al. (1996).