

and could be regarded as the most compelling null
hypothesis, although it is the deterministic cause
that is usually assumed to be correct.
A third example is perhaps even more troubling: Fig. 2.1.6a shows Brooks’s (1923) demonstration that central African lake levels appear to
follow the 11-year sunspot cycle. Figure 2.1.6b
shows what happened subsequently. The reader
is referred to Pittock (1978) for this and many
other examples where short-record visual correlations suggested a non-existent causal relationship. Similar published examples of misleading
short-record correlations can be replicated indefinitely. The problem is greatly compounded when
investigators start to shift in time the relative positions of two or more records so as to determine
time lags. The probability of ‘false positives’ then
grows enormously.
None of these examples just cited can be used
to refute the possibility that climate change is simply causal, and so simply interpretable, and possibly even predictable. All they do is suggest that,
for some purposes, there is no substitute for very
long records over the entire global ocean. Climate
will never be properly understood until the records
encompass many realizations of the time scales
one is examining (as scientific history seems to
show to be true for all physical phenomena).
2.1 Global Problems and Global Observations
55
Wunsch
4
Temperature
3
2
1
0
–1
–2
–3
–4
0 500
(a)
Time
1000 1500
2500 3000 3500 4000 4500 5000
2000
0.4
Heat flux
0.3
0.2
0.1
0
–0.1
–0.2
–0.3
–0.4
0 500
(b)
Time
1000 1500
2500 3000 3500 4000 4500 5000
2000
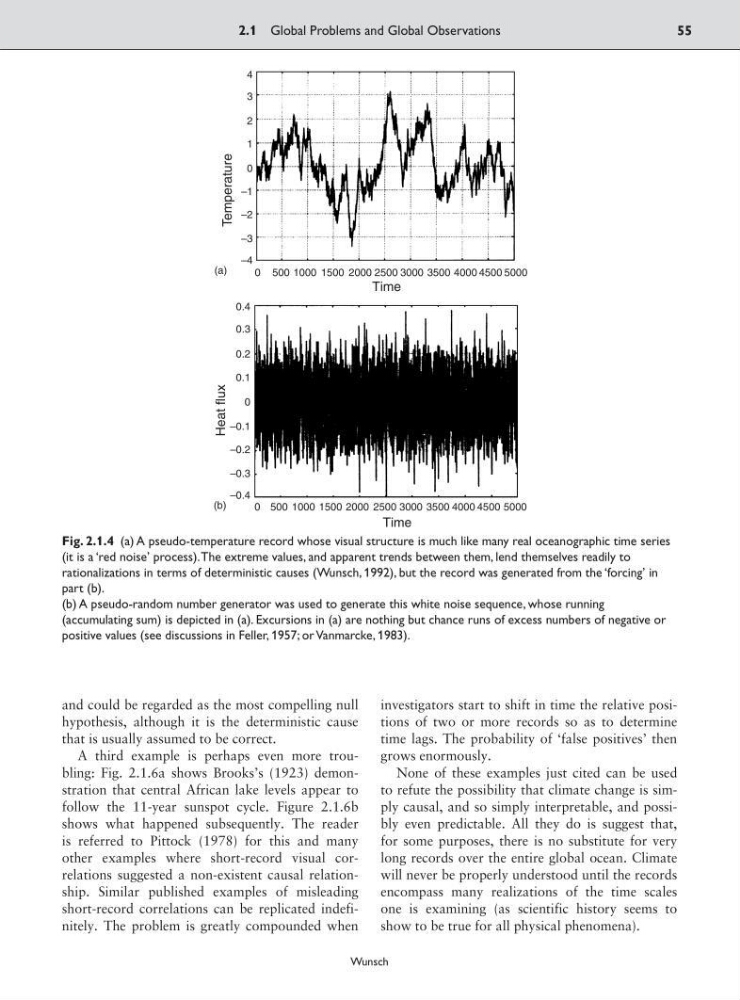
Fig. 2.1.4 (a) A pseudo-temperature record whose visual structure is much like many real oceanographic time series
(it is a ‘red noise’ process).The extreme values, and apparent trends between them, lend themselves readily to
rationalizations in terms of deterministic causes (Wunsch, 1992), but the record was generated from the ‘forcing’ in
part (b).
(b) A pseudo-random number generator was used to generate this white noise sequence, whose running
(accumulating sum) is depicted in (a). Excursions in (a) are nothing but chance runs of excess numbers of negative or
positive values (see discussions in Feller, 1957; or Vanmarcke, 1983).
hypothesis, although it is the deterministic cause
that is usually assumed to be correct.
A third example is perhaps even more troubling: Fig. 2.1.6a shows Brooks’s (1923) demonstration that central African lake levels appear to
follow the 11-year sunspot cycle. Figure 2.1.6b
shows what happened subsequently. The reader
is referred to Pittock (1978) for this and many
other examples where short-record visual correlations suggested a non-existent causal relationship. Similar published examples of misleading
short-record correlations can be replicated indefinitely. The problem is greatly compounded when
investigators start to shift in time the relative positions of two or more records so as to determine
time lags. The probability of ‘false positives’ then
grows enormously.
None of these examples just cited can be used
to refute the possibility that climate change is simply causal, and so simply interpretable, and possibly even predictable. All they do is suggest that,
for some purposes, there is no substitute for very
long records over the entire global ocean. Climate
will never be properly understood until the records
encompass many realizations of the time scales
one is examining (as scientific history seems to
show to be true for all physical phenomena).
2.1 Global Problems and Global Observations
55
Wunsch
4
Temperature
3
2
1
0
–1
–2
–3
–4
0 500
(a)
Time
1000 1500
2500 3000 3500 4000 4500 5000
2000
0.4
Heat flux
0.3
0.2
0.1
0
–0.1
–0.2
–0.3
–0.4
0 500
(b)
Time
1000 1500
2500 3000 3500 4000 4500 5000
2000
Fig. 2.1.4 (a) A pseudo-temperature record whose visual structure is much like many real oceanographic time series
(it is a ‘red noise’ process).The extreme values, and apparent trends between them, lend themselves readily to
rationalizations in terms of deterministic causes (Wunsch, 1992), but the record was generated from the ‘forcing’ in
part (b).
(b) A pseudo-random number generator was used to generate this white noise sequence, whose running
(accumulating sum) is depicted in (a). Excursions in (a) are nothing but chance runs of excess numbers of negative or
positive values (see discussions in Feller, 1957; or Vanmarcke, 1983).