

variability with seasonal variability in the mass
transport must be considered in future studies. To
date most carbon transport estimates are based on
annual mean mass transports (e.g. annual mean
Ekman transports) multiplied by inorganic carbon
distributions that were measured exclusively in
summertime.
Atlantic carbon transport: WOCE-era results
Holfort et al. (1998) constructed preindustrial,
contemporary and Excess carbon budgets for the
South Atlantic subtropical gyre (10–30°S) based
mainly on analysis of WOCE and SAVE data. They
estimated a contemporary transport of carbon
southwards across 20°S of ϳ2150 kmol s
91
(0.81 PgC yr
91
; 1 PgC yr
91
:2640 kmol s
91
). Based
on sensitivity studies and the analysis of several
sections, the uncertainty of this estimate was placed
at about 200 kmol s
91
. A notable finding was that
the net transport of Excess CO 2 across 20°S in
the Atlantic was of the order of 430 kmol s
91
(0.16 PgC yr
91
) northwards (with an uncertainty
of about 100 kmol s
91
). Hence the preindustrial
southwards carbon transport was estimated to
have been 2580 kmol s
91 or 0.98 PgC yr
91
. The net
northwards transport of Excess CO 2 results from
the labelling of the northward-flowing upper limb
of the Atlantic’s meridional overturning circulation
with Excess CO 2 , whereas deeper, older southward-flowing waters at this latitude still contain little Excess CO 2 (see Fig. 6.3.8). This net northward
transport across 20°S is of a significant magnitude
(order 50%) relative to the total estimated rate of
storage of Excess CO 2 within the Atlantic north of
this latitude (Holfort et al., 1998).
Most recently, Rosón et al. (2000) have
analysed carbon transports across the WOCE A5
section at 24.5°N based on the mass transports
calculated by Lavín et al. (1998). Using their estimates, together with the other literature estimates,
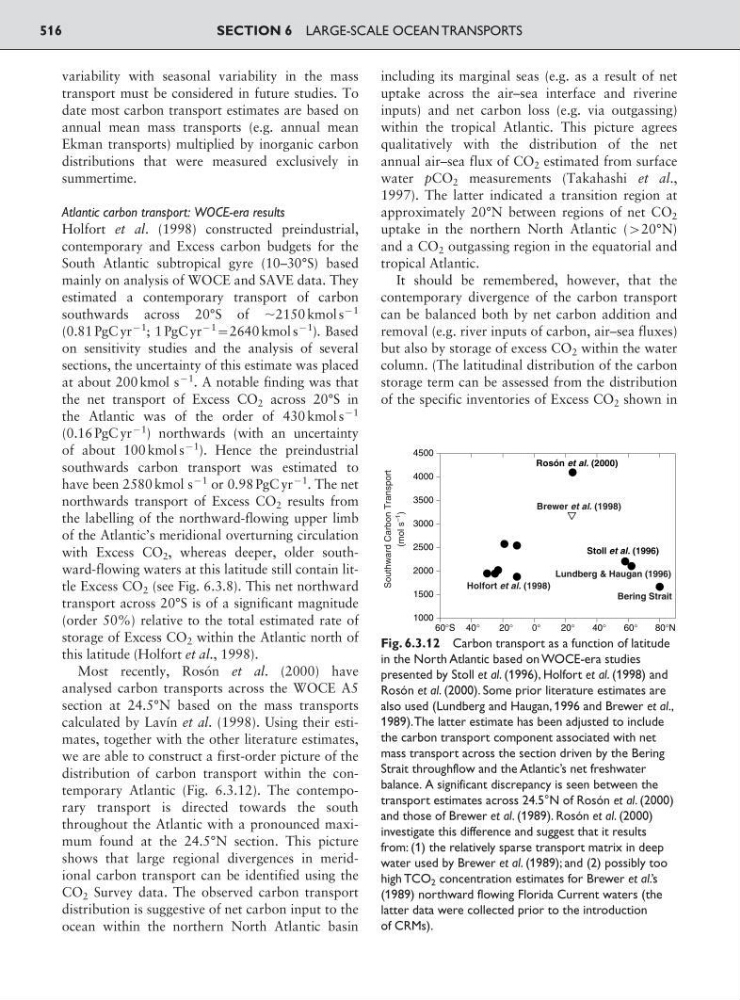
we are able to construct a first-order picture of the
distribution of carbon transport within the contemporary Atlantic (Fig. 6.3.12). The contemporary transport is directed towards the south
throughout the Atlantic with a pronounced maximum found at the 24.5°N section. This picture
shows that large regional divergences in meridional carbon transport can be identified using the
CO 2 Survey data. The observed carbon transport
distribution is suggestive of net carbon input to the
ocean within the northern North Atlantic basin
including its marginal seas (e.g. as a result of net
uptake across the air–sea interface and riverine
inputs) and net carbon loss (e.g. via outgassing)
within the tropical Atlantic. This picture agrees
qualitatively with the distribution of the net
annual air–sea flux of CO 2 estimated from surface
water pCO 2 measurements (Takahashi et al.,
1997). The latter indicated a transition region at
approximately 20°N between regions of net CO 2
uptake in the northern North Atlantic (920°N)
and a CO 2 outgassing region in the equatorial and
tropical Atlantic.
It should be remembered, however, that the
contemporary divergence of the carbon transport
can be balanced both by net carbon addition and
removal (e.g. river inputs of carbon, air–sea fluxes)
but also by storage of excess CO 2 within the water
column. (The latitudinal distribution of the carbon
storage term can be assessed from the distribution
of the specific inventories of Excess CO 2 shown in
SECTION 6 LARGE-SCALE OCEAN TRANSPORTS
516
60°S 40°
20°
20°
40°
60°
80°N
1000
1500
2000
2500
3000
3500
4000
4500
Rosón et al. (2000)
Stoll et al. (1996)
Southward Carbon Transport
(mol s
–1
)
0°
Brewer et al. (1998)
Holfort et al. (1998)
Lundberg & Haugan (1996)
Bering Strait
Fig. 6.3.12 Carbon transport as a function of latitude
in the North Atlantic based on WOCE-era studies
presented by Stoll et al. (1996), Holfort et al. (1998) and
Rosón et al. (2000). Some prior literature estimates are
also used (Lundberg and Haugan, 1996 and Brewer et al.,
1989).The latter estimate has been adjusted to include
the carbon transport component associated with net
mass transport across the section driven by the Bering
Strait throughflow and the Atlantic’s net freshwater
balance. A significant discrepancy is seen between the
transport estimates across 24.5°N of Rosón et al. (2000)
and those of Brewer et al. (1989). Rosón et al. (2000)
investigate this difference and suggest that it results
from: (1) the relatively sparse transport matrix in deep
water used by Brewer et al. (1989); and (2) possibly too
high TCO 2 concentration estimates for Brewer et al.’s
(1989) northward flowing Florida Current waters (the
latter data were collected prior to the introduction
of CRMs).
transport must be considered in future studies. To
date most carbon transport estimates are based on
annual mean mass transports (e.g. annual mean
Ekman transports) multiplied by inorganic carbon
distributions that were measured exclusively in
summertime.
Atlantic carbon transport: WOCE-era results
Holfort et al. (1998) constructed preindustrial,
contemporary and Excess carbon budgets for the
South Atlantic subtropical gyre (10–30°S) based
mainly on analysis of WOCE and SAVE data. They
estimated a contemporary transport of carbon
southwards across 20°S of ϳ2150 kmol s
91
(0.81 PgC yr
91
; 1 PgC yr
91
:2640 kmol s
91
). Based
on sensitivity studies and the analysis of several
sections, the uncertainty of this estimate was placed
at about 200 kmol s
91
. A notable finding was that
the net transport of Excess CO 2 across 20°S in
the Atlantic was of the order of 430 kmol s
91
(0.16 PgC yr
91
) northwards (with an uncertainty
of about 100 kmol s
91
). Hence the preindustrial
southwards carbon transport was estimated to
have been 2580 kmol s
91 or 0.98 PgC yr
91
. The net
northwards transport of Excess CO 2 results from
the labelling of the northward-flowing upper limb
of the Atlantic’s meridional overturning circulation
with Excess CO 2 , whereas deeper, older southward-flowing waters at this latitude still contain little Excess CO 2 (see Fig. 6.3.8). This net northward
transport across 20°S is of a significant magnitude
(order 50%) relative to the total estimated rate of
storage of Excess CO 2 within the Atlantic north of
this latitude (Holfort et al., 1998).
Most recently, Rosón et al. (2000) have
analysed carbon transports across the WOCE A5
section at 24.5°N based on the mass transports
calculated by Lavín et al. (1998). Using their estimates, together with the other literature estimates,
we are able to construct a first-order picture of the
distribution of carbon transport within the contemporary Atlantic (Fig. 6.3.12). The contemporary transport is directed towards the south
throughout the Atlantic with a pronounced maximum found at the 24.5°N section. This picture
shows that large regional divergences in meridional carbon transport can be identified using the
CO 2 Survey data. The observed carbon transport
distribution is suggestive of net carbon input to the
ocean within the northern North Atlantic basin
including its marginal seas (e.g. as a result of net
uptake across the air–sea interface and riverine
inputs) and net carbon loss (e.g. via outgassing)
within the tropical Atlantic. This picture agrees
qualitatively with the distribution of the net
annual air–sea flux of CO 2 estimated from surface
water pCO 2 measurements (Takahashi et al.,
1997). The latter indicated a transition region at
approximately 20°N between regions of net CO 2
uptake in the northern North Atlantic (920°N)
and a CO 2 outgassing region in the equatorial and
tropical Atlantic.
It should be remembered, however, that the
contemporary divergence of the carbon transport
can be balanced both by net carbon addition and
removal (e.g. river inputs of carbon, air–sea fluxes)
but also by storage of excess CO 2 within the water
column. (The latitudinal distribution of the carbon
storage term can be assessed from the distribution
of the specific inventories of Excess CO 2 shown in
SECTION 6 LARGE-SCALE OCEAN TRANSPORTS
516
60°S 40°
20°
20°
40°
60°
80°N
1000
1500
2000
2500
3000
3500
4000
4500
Rosón et al. (2000)
Stoll et al. (1996)
Southward Carbon Transport
(mol s
–1
)
0°
Brewer et al. (1998)
Holfort et al. (1998)
Lundberg & Haugan (1996)
Bering Strait
Fig. 6.3.12 Carbon transport as a function of latitude
in the North Atlantic based on WOCE-era studies
presented by Stoll et al. (1996), Holfort et al. (1998) and
Rosón et al. (2000). Some prior literature estimates are
also used (Lundberg and Haugan, 1996 and Brewer et al.,
1989).The latter estimate has been adjusted to include
the carbon transport component associated with net
mass transport across the section driven by the Bering
Strait throughflow and the Atlantic’s net freshwater
balance. A significant discrepancy is seen between the
transport estimates across 24.5°N of Rosón et al. (2000)
and those of Brewer et al. (1989). Rosón et al. (2000)
investigate this difference and suggest that it results
from: (1) the relatively sparse transport matrix in deep
water used by Brewer et al. (1989); and (2) possibly too
high TCO 2 concentration estimates for Brewer et al.’s
(1989) northward flowing Florida Current waters (the
latter data were collected prior to the introduction
of CRMs).