

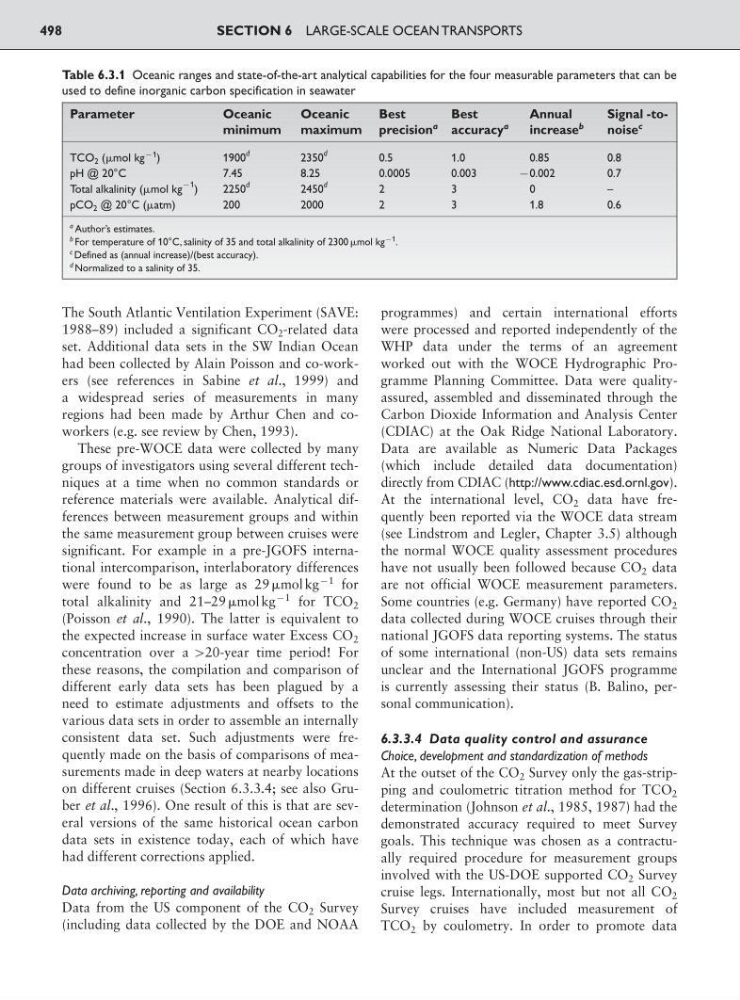
The South Atlantic Ventilation Experiment (SAVE:
1988–89) included a significant CO 2 -related data
set. Additional data sets in the SW Indian Ocean
had been collected by Alain Poisson and co-workers (see references in Sabine et al., 1999) and
a widespread series of measurements in many
regions had been made by Arthur Chen and coworkers (e.g. see review by Chen, 1993).
These pre-WOCE data were collected by many
groups of investigators using several different techniques at a time when no common standards or
reference materials were available. Analytical differences between measurement groups and within
the same measurement group between cruises were
significant. For example in a pre-JGOFS international intercomparison, interlaboratory differences
were found to be as large as 29 mol kg
91 for
total alkalinity and 21–29 mol kg
91 for TCO 2
(Poisson et al., 1990). The latter is equivalent to
the expected increase in surface water Excess CO 2
concentration over a 920-year time period! For
these reasons, the compilation and comparison of
different early data sets has been plagued by a
need to estimate adjustments and offsets to the
various data sets in order to assemble an internally
consistent data set. Such adjustments were frequently made on the basis of comparisons of measurements made in deep waters at nearby locations
on different cruises (Section 6.3.3.4; see also Gruber et al., 1996). One result of this is that are several versions of the same historical ocean carbon
data sets in existence today, each of which have
had different corrections applied.
Data archiving, reporting and availability
Data from the US component of the CO 2 Survey
(including data collected by the DOE and NOAA
programmes) and certain international efforts
were processed and reported independently of the
WHP data under the terms of an agreement
worked out with the WOCE Hydrographic Programme Planning Committee. Data were qualityassured, assembled and disseminated through the
Carbon Dioxide Information and Analysis Center
(CDIAC) at the Oak Ridge National Laboratory.
Data are available as Numeric Data Packages
(which include detailed data documentation)
directly from CDIAC (http://www.cdiac.esd.ornl.gov).
At the international level, CO 2 data have frequently been reported via the WOCE data stream
(see Lindstrom and Legler, Chapter 3.5) although
the normal WOCE quality assessment procedures
have not usually been followed because CO 2 data
are not official WOCE measurement parameters.
Some countries (e.g. Germany) have reported CO 2
data collected during WOCE cruises through their
national JGOFS data reporting systems. The status
of some international (non-US) data sets remains
unclear and the International JGOFS programme
is currently assessing their status (B. Balino, personal communication).
6.3.3.4 Data quality control and assurance
Choice, development and standardization of methods
At the outset of the CO 2 Survey only the gas-stripping and coulometric titration method for TCO 2
determination (Johnson et al., 1985, 1987) had the
demonstrated accuracy required to meet Survey
goals. This technique was chosen as a contractually required procedure for measurement groups
involved with the US-DOE supported CO 2 Survey
cruise legs. Internationally, most but not all CO 2
Survey cruises have included measurement of
TCO 2 by coulometry. In order to promote data
SECTION 6 LARGE-SCALE OCEAN TRANSPORTS
498
Table 6.3.1 Oceanic ranges and state-of-the-art analytical capabilities for the four measurable parameters that can be
used to define inorganic carbon specification in seawater
Parameter
Oceanic
Oceanic
Best
Best
Annual
Signal -tominimum maximum precision
a accuracy
a
increase
b
noise
c
TCO 2 (mol kg
91 )
1900
d
2350
d
0.5
1 .0
0 .85
0.8
pH @ 20°C
7.45
8.25
0.0005
0.003
90.002
0.7
Total alkalinity (mol kg
91
)
2250
d
2450
d
2
3
0
–
pCO 2 @ 20°C (atm)
200
2000
2
3
1.8
0 .6
a Author’s estimates.
b For temperature of 10°C, salinity of 35 and total alkalinity of 2300 mol kg
91
.
c Defined as (annual increase)/(best accuracy).
d Normalized to a salinity of 35.
1988–89) included a significant CO 2 -related data
set. Additional data sets in the SW Indian Ocean
had been collected by Alain Poisson and co-workers (see references in Sabine et al., 1999) and
a widespread series of measurements in many
regions had been made by Arthur Chen and coworkers (e.g. see review by Chen, 1993).
These pre-WOCE data were collected by many
groups of investigators using several different techniques at a time when no common standards or
reference materials were available. Analytical differences between measurement groups and within
the same measurement group between cruises were
significant. For example in a pre-JGOFS international intercomparison, interlaboratory differences
were found to be as large as 29 mol kg
91 for
total alkalinity and 21–29 mol kg
91 for TCO 2
(Poisson et al., 1990). The latter is equivalent to
the expected increase in surface water Excess CO 2
concentration over a 920-year time period! For
these reasons, the compilation and comparison of
different early data sets has been plagued by a
need to estimate adjustments and offsets to the
various data sets in order to assemble an internally
consistent data set. Such adjustments were frequently made on the basis of comparisons of measurements made in deep waters at nearby locations
on different cruises (Section 6.3.3.4; see also Gruber et al., 1996). One result of this is that are several versions of the same historical ocean carbon
data sets in existence today, each of which have
had different corrections applied.
Data archiving, reporting and availability
Data from the US component of the CO 2 Survey
(including data collected by the DOE and NOAA
programmes) and certain international efforts
were processed and reported independently of the
WHP data under the terms of an agreement
worked out with the WOCE Hydrographic Programme Planning Committee. Data were qualityassured, assembled and disseminated through the
Carbon Dioxide Information and Analysis Center
(CDIAC) at the Oak Ridge National Laboratory.
Data are available as Numeric Data Packages
(which include detailed data documentation)
directly from CDIAC (http://www.cdiac.esd.ornl.gov).
At the international level, CO 2 data have frequently been reported via the WOCE data stream
(see Lindstrom and Legler, Chapter 3.5) although
the normal WOCE quality assessment procedures
have not usually been followed because CO 2 data
are not official WOCE measurement parameters.
Some countries (e.g. Germany) have reported CO 2
data collected during WOCE cruises through their
national JGOFS data reporting systems. The status
of some international (non-US) data sets remains
unclear and the International JGOFS programme
is currently assessing their status (B. Balino, personal communication).
6.3.3.4 Data quality control and assurance
Choice, development and standardization of methods
At the outset of the CO 2 Survey only the gas-stripping and coulometric titration method for TCO 2
determination (Johnson et al., 1985, 1987) had the
demonstrated accuracy required to meet Survey
goals. This technique was chosen as a contractually required procedure for measurement groups
involved with the US-DOE supported CO 2 Survey
cruise legs. Internationally, most but not all CO 2
Survey cruises have included measurement of
TCO 2 by coulometry. In order to promote data
SECTION 6 LARGE-SCALE OCEAN TRANSPORTS
498
Table 6.3.1 Oceanic ranges and state-of-the-art analytical capabilities for the four measurable parameters that can be
used to define inorganic carbon specification in seawater
Parameter
Oceanic
Oceanic
Best
Best
Annual
Signal -tominimum maximum precision
a accuracy
a
increase
b
noise
c
TCO 2 (mol kg
91 )
1900
d
2350
d
0.5
1 .0
0 .85
0.8
pH @ 20°C
7.45
8.25
0.0005
0.003
90.002
0.7
Total alkalinity (mol kg
91
)
2250
d
2450
d
2
3
0
–
pCO 2 @ 20°C (atm)
200
2000
2
3
1.8
0 .6
a Author’s estimates.
b For temperature of 10°C, salinity of 35 and total alkalinity of 2300 mol kg
91
.
c Defined as (annual increase)/(best accuracy).
d Normalized to a salinity of 35.