

SECTION 6 LARGE-SCALE OCEAN TRANSPORTS
494
340
340
356
356
348
348
Data
Data
No terrestrial sink
Northern hemisphere terrestrial sink
North
Equator
South
North
Equator
South North
Equator
South
North
Equator
South
+CO 2
+CO 2
+CO 2
+CO 2
Atmos. transport model
Atmos. transport model
CO
2
conc. (atm)
CO
2
conc. (atm)
(a)
270
340
290
356
280
348
Data
Preindustrial
Now
?
(b)
North
Equator
South North
Equator
South
North
Equator
South North
Equator
South
Atmospheric
CO 2 gradient
Atmospheric
CO 2 gradient
+CO 2
+CO 2
CO
2
conc. (atm)
CO
2
conc. (atm)
Excess CO 2
Natural carbon cycle
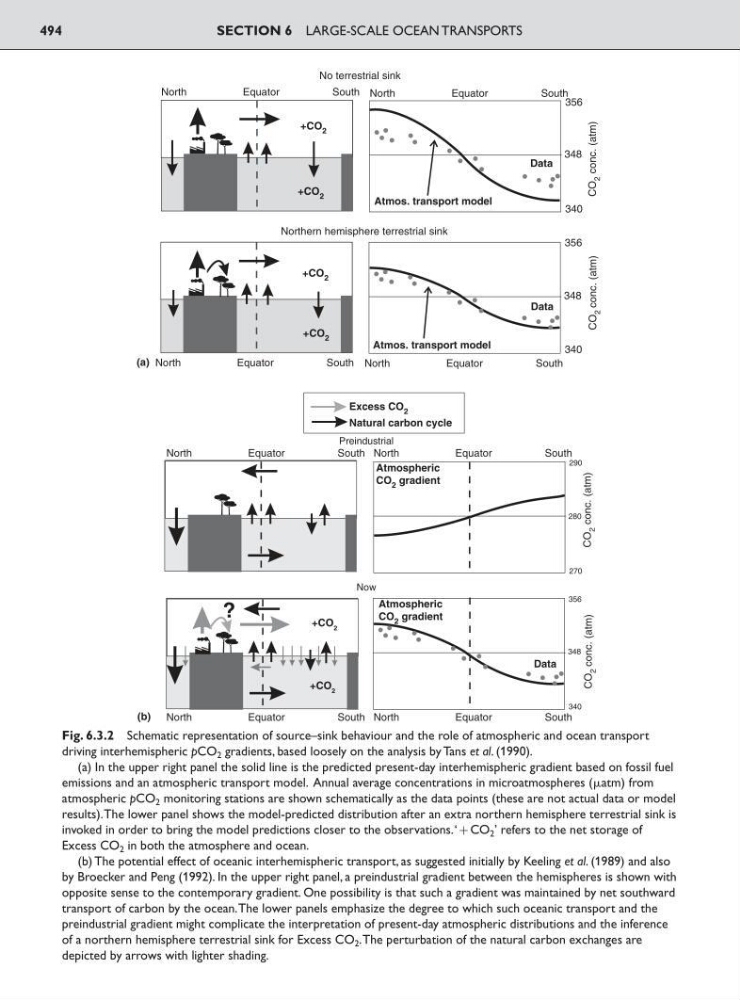
Fig. 6.3.2 Schematic representation of source–sink behaviour and the role of atmospheric and ocean transport
driving interhemispheric pCO 2 gradients, based loosely on the analysis by Tans et al. (1990).
(a) In the upper right panel the solid line is the predicted present-day interhemispheric gradient based on fossil fuel
emissions and an atmospheric transport model. Annual average concentrations in microatmospheres (atm) from
atmospheric pCO 2 monitoring stations are shown schematically as the data points (these are not actual data or model
results).The lower panel shows the model-predicted distribution after an extra northern hemisphere terrestrial sink is
invoked in order to bring the model predictions closer to the observations.‘;CO 2 ’ refers to the net storage of
Excess CO 2 in both the atmosphere and ocean.
(b) The potential effect of oceanic interhemispheric transport, as suggested initially by Keeling et al. (1989) and also
by Broecker and Peng (1992). In the upper right panel, a preindustrial gradient between the hemispheres is shown with
opposite sense to the contemporary gradient. One possibility is that such a gradient was maintained by net southward
transport of carbon by the ocean.The lower panels emphasize the degree to which such oceanic transport and the
preindustrial gradient might complicate the interpretation of present-day atmospheric distributions and the inference
of a northern hemisphere terrestrial sink for Excess CO 2 .The perturbation of the natural carbon exchanges are
depicted by arrows with lighter shading.
494
340
340
356
356
348
348
Data
Data
No terrestrial sink
Northern hemisphere terrestrial sink
North
Equator
South
North
Equator
South North
Equator
South
North
Equator
South
+CO 2
+CO 2
+CO 2
+CO 2
Atmos. transport model
Atmos. transport model
CO
2
conc. (atm)
CO
2
conc. (atm)
(a)
270
340
290
356
280
348
Data
Preindustrial
Now
?
(b)
North
Equator
South North
Equator
South
North
Equator
South North
Equator
South
Atmospheric
CO 2 gradient
Atmospheric
CO 2 gradient
+CO 2
+CO 2
CO
2
conc. (atm)
CO
2
conc. (atm)
Excess CO 2
Natural carbon cycle
Fig. 6.3.2 Schematic representation of source–sink behaviour and the role of atmospheric and ocean transport
driving interhemispheric pCO 2 gradients, based loosely on the analysis by Tans et al. (1990).
(a) In the upper right panel the solid line is the predicted present-day interhemispheric gradient based on fossil fuel
emissions and an atmospheric transport model. Annual average concentrations in microatmospheres (atm) from
atmospheric pCO 2 monitoring stations are shown schematically as the data points (these are not actual data or model
results).The lower panel shows the model-predicted distribution after an extra northern hemisphere terrestrial sink is
invoked in order to bring the model predictions closer to the observations.‘;CO 2 ’ refers to the net storage of
Excess CO 2 in both the atmosphere and ocean.
(b) The potential effect of oceanic interhemispheric transport, as suggested initially by Keeling et al. (1989) and also
by Broecker and Peng (1992). In the upper right panel, a preindustrial gradient between the hemispheres is shown with
opposite sense to the contemporary gradient. One possibility is that such a gradient was maintained by net southward
transport of carbon by the ocean.The lower panels emphasize the degree to which such oceanic transport and the
preindustrial gradient might complicate the interpretation of present-day atmospheric distributions and the inference
of a northern hemisphere terrestrial sink for Excess CO 2 .The perturbation of the natural carbon exchanges are
depicted by arrows with lighter shading.