

A second source of temporal rectification
between S and v is in the seasonal cycle in the
Ekman layer. Seasonal changes in wind strength can
coincide with changes in freshwater forcing and
salinity. To examine how large these fluxes might
be, the rectification flux was calculated for each
ocean basin using the Hellerman and Rosenstein
(1983) wind-stress climatology and the Levitus
and Boyer (1994b) sea surface salinity (Fig. 6.2.4).
Outside the tropics the freshwater flux is less than
0.02 Sv, which is negligible. These estimates, along
with those from Stammer (1998), agree with those
from high-resolution modelling studies, which find
the temporal rectification terms (over all time
scales) give fluxes of:0.1 Sv outside of the tropics
(McCann et al., 1994).
In total then, the expected uncertainty in the
direct flux estimates might be as large as 0.17 Sv
outside of the tropics (6.2.8), but may reach 0.3 Sv
in the tropics. Independently, Dobroliubov (1997)
finds similar uncertainties. To go beyond the simple scaling argument in equation (6.2.7) requires
simultaneous time series of both velocity and salinity
overbasin scales, measurements that are not yet
available.
6.2.5 Comparison of direct and indirect
flux estimates
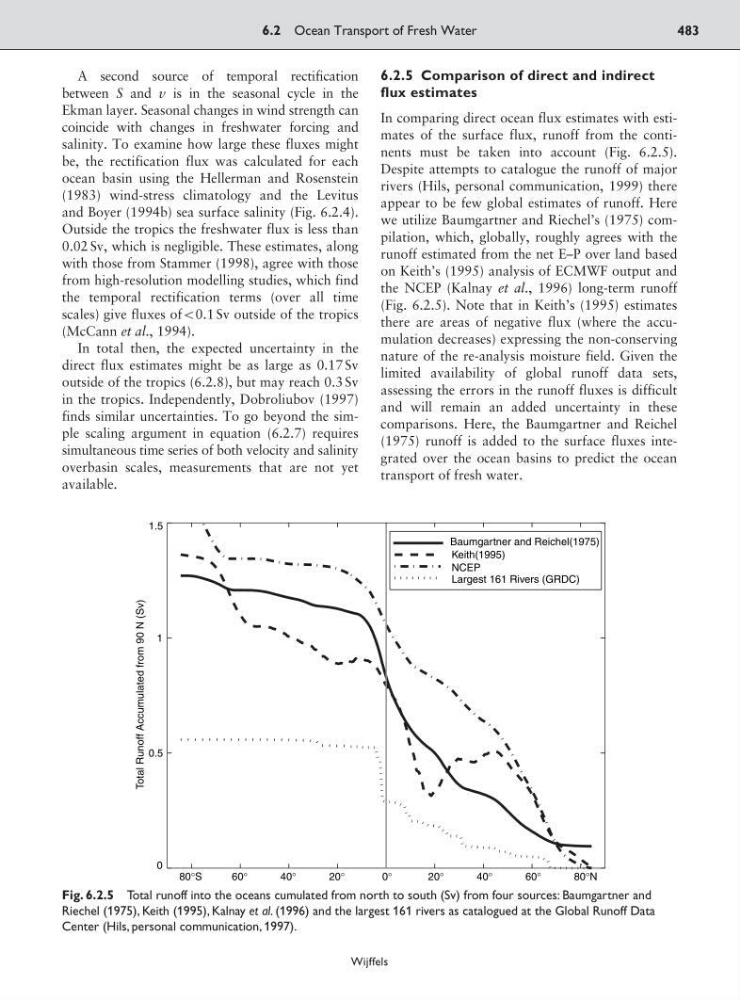
In comparing direct ocean flux estimates with estimates of the surface flux, runoff from the continents must be taken into account (Fig. 6.2.5).
Despite attempts to catalogue the runoff of major
rivers (Hils, personal communication, 1999) there
appear to be few global estimates of runoff. Here
we utilize Baumgartner and Riechel’s (1975) compilation, which, globally, roughly agrees with the
runoff estimated from the net E–P over land based
on Keith’s (1995) analysis of ECMWF output and
the NCEP (Kalnay et al., 1996) long-term runoff
(Fig. 6.2.5). Note that in Keith’s (1995) estimates
there are areas of negative flux (where the accumulation decreases) expressing the non-conserving
nature of the re-analysis moisture field. Given the
limited availability of global runoff data sets,
assessing the errors in the runoff fluxes is difficult
and will remain an added uncertainty in these
comparisons. Here, the Baumgartner and Reichel
(1975) runoff is added to the surface fluxes integrated over the ocean basins to predict the ocean
transport of fresh water.
6.2 Ocean Transport of Fresh Water
483
Wijffels
80°S
60°
40°
20°
0°
20°
40°
60°
80°N
0
0.5
1
1.5
Total Runoff Accumulated from 90 N (Sv)
Baumgartner and Reichel(1975)
Keith(1995)
NCEP
Largest 161 Rivers (GRDC)
Fig. 6.2.5 Total runoff into the oceans cumulated from north to south (Sv) from four sources: Baumgartner and
Riechel (1975), Keith (1995), Kalnay et al. (1996) and the largest 161 rivers as catalogued at the Global Runoff Data
Center (Hils, personal communication, 1997).
between S and v is in the seasonal cycle in the
Ekman layer. Seasonal changes in wind strength can
coincide with changes in freshwater forcing and
salinity. To examine how large these fluxes might
be, the rectification flux was calculated for each
ocean basin using the Hellerman and Rosenstein
(1983) wind-stress climatology and the Levitus
and Boyer (1994b) sea surface salinity (Fig. 6.2.4).
Outside the tropics the freshwater flux is less than
0.02 Sv, which is negligible. These estimates, along
with those from Stammer (1998), agree with those
from high-resolution modelling studies, which find
the temporal rectification terms (over all time
scales) give fluxes of:0.1 Sv outside of the tropics
(McCann et al., 1994).
In total then, the expected uncertainty in the
direct flux estimates might be as large as 0.17 Sv
outside of the tropics (6.2.8), but may reach 0.3 Sv
in the tropics. Independently, Dobroliubov (1997)
finds similar uncertainties. To go beyond the simple scaling argument in equation (6.2.7) requires
simultaneous time series of both velocity and salinity
overbasin scales, measurements that are not yet
available.
6.2.5 Comparison of direct and indirect
flux estimates
In comparing direct ocean flux estimates with estimates of the surface flux, runoff from the continents must be taken into account (Fig. 6.2.5).
Despite attempts to catalogue the runoff of major
rivers (Hils, personal communication, 1999) there
appear to be few global estimates of runoff. Here
we utilize Baumgartner and Riechel’s (1975) compilation, which, globally, roughly agrees with the
runoff estimated from the net E–P over land based
on Keith’s (1995) analysis of ECMWF output and
the NCEP (Kalnay et al., 1996) long-term runoff
(Fig. 6.2.5). Note that in Keith’s (1995) estimates
there are areas of negative flux (where the accumulation decreases) expressing the non-conserving
nature of the re-analysis moisture field. Given the
limited availability of global runoff data sets,
assessing the errors in the runoff fluxes is difficult
and will remain an added uncertainty in these
comparisons. Here, the Baumgartner and Reichel
(1975) runoff is added to the surface fluxes integrated over the ocean basins to predict the ocean
transport of fresh water.
6.2 Ocean Transport of Fresh Water
483
Wijffels
80°S
60°
40°
20°
0°
20°
40°
60°
80°N
0
0.5
1
1.5
Total Runoff Accumulated from 90 N (Sv)
Baumgartner and Reichel(1975)
Keith(1995)
NCEP
Largest 161 Rivers (GRDC)
Fig. 6.2.5 Total runoff into the oceans cumulated from north to south (Sv) from four sources: Baumgartner and
Riechel (1975), Keith (1995), Kalnay et al. (1996) and the largest 161 rivers as catalogued at the Global Runoff Data
Center (Hils, personal communication, 1997).