

flow of the interior ocean is divided into baroclinic
and barotropic components: the baroclinic field is
obtained by geostrophic calculation using the transPacific hydrographic data with a reference level of
2500 dbar. The barotropic mass transport is calculated so that the interior mass transport balances
the Kuroshio transport at the western boundary.
The interior temperature transport is estimated
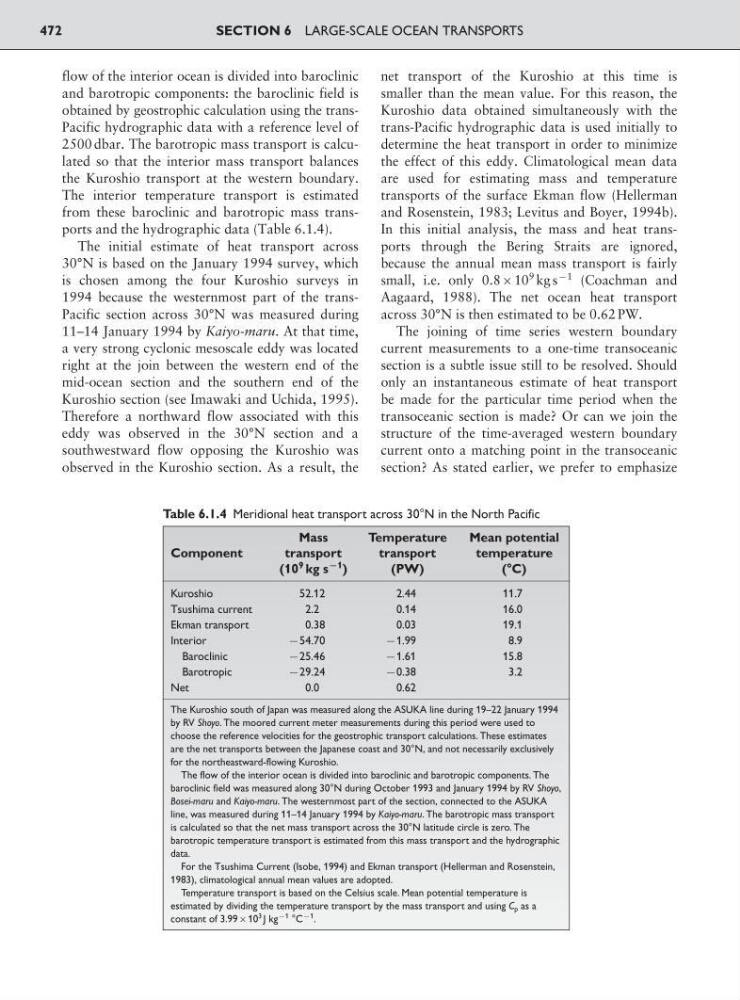
from these baroclinic and barotropic mass transports and the hydrographic data (Table 6.1.4).
The initial estimate of heat transport across
30°N is based on the January 1994 survey, which
is chosen among the four Kuroshio surveys in
1994 because the westernmost part of the transPacific section across 30°N was measured during
11–14 January 1994 by Kaiyo-maru. At that time,
a very strong cyclonic mesoscale eddy was located
right at the join between the western end of the
mid-ocean section and the southern end of the
Kuroshio section (see Imawaki and Uchida, 1995).
Therefore a northward flow associated with this
eddy was observed in the 30°N section and a
southwestward flow opposing the Kuroshio was
observed in the Kuroshio section. As a result, the
net transport of the Kuroshio at this time is
smaller than the mean value. For this reason, the
Kuroshio data obtained simultaneously with the
trans-Pacific hydrographic data is used initially to
determine the heat transport in order to minimize
the effect of this eddy. Climatological mean data
are used for estimating mass and temperature
transports of the surface Ekman flow (Hellerman
and Rosenstein, 1983; Levitus and Boyer, 1994b).
In this initial analysis, the mass and heat transports through the Bering Straits are ignored,
because the annual mean mass transport is fairly
small, i.e. only 0.810
9 kg s
91 (Coachman and
Aagaard, 1988). The net ocean heat transport
across 30°N is then estimated to be 0.62 PW.
The joining of time series western boundary
current measurements to a one-time transoceanic
section is a subtle issue still to be resolved. Should
only an instantaneous estimate of heat transport
be made for the particular time period when the
transoceanic section is made? Or can we join the
structure of the time-averaged western boundary
current onto a matching point in the transoceanic
section? As stated earlier, we prefer to emphasize
SECTION 6 LARGE-SCALE OCEAN TRANSPORTS
472
Table 6.1.4 Meridional heat transport across 30°N in the North Pacific
Mass
Temperature
Mean potential
Component
transport
transport
temperature
(10
9 kg s
91 )
(PW)
(°C)
Kuroshio
52.12
2.44
11.7
Tsushima current
2.2
0.14
16.0
Ekman transport
0.38
0.03
19.1
Interior
954.70
91.99
8.9
Baroclinic
925.46
91.61
15.8
Barotropic
929.24
90.38
3.2
Net
0.0
0.62
The Kuroshio south of Japan was measured along the ASUKA line during 19–22 January 1994
by RV Shoyo. The moored current meter measurements during this period were used to
choose the reference velocities for the geostrophic transport calculations. These estimates
are the net transports between the Japanese coast and 30°N, and not necessarily exclusively
for the northeastward-flowing Kuroshio.
The flow of the interior ocean is divided into baroclinic and barotropic components. The
baroclinic field was measured along 30°N during October 1993 and January 1994 by RV Shoyo,
Bosei-maru and Kaiyo-maru. The westernmost part of the section, connected to the ASUKA
line, was measured during 11–14 January 1994 by Kaiyo-maru. The barotropic mass transport
is calculated so that the net mass transport across the 30°N latitude circle is zero. The
barotropic temperature transport is estimated from this mass transport and the hydrographic
data.
For the Tsushima Current (Isobe, 1994) and Ekman transport (Hellerman and Rosenstein,
1983), climatological annual mean values are adopted.
Temperature transport is based on the Celsius scale. Mean potential temperature is
estimated by dividing the temperature transport by the mass transport and using C p as a
constant of 3.9910
3 J kg
91 °C
91
.
and barotropic components: the baroclinic field is
obtained by geostrophic calculation using the transPacific hydrographic data with a reference level of
2500 dbar. The barotropic mass transport is calculated so that the interior mass transport balances
the Kuroshio transport at the western boundary.
The interior temperature transport is estimated
from these baroclinic and barotropic mass transports and the hydrographic data (Table 6.1.4).
The initial estimate of heat transport across
30°N is based on the January 1994 survey, which
is chosen among the four Kuroshio surveys in
1994 because the westernmost part of the transPacific section across 30°N was measured during
11–14 January 1994 by Kaiyo-maru. At that time,
a very strong cyclonic mesoscale eddy was located
right at the join between the western end of the
mid-ocean section and the southern end of the
Kuroshio section (see Imawaki and Uchida, 1995).
Therefore a northward flow associated with this
eddy was observed in the 30°N section and a
southwestward flow opposing the Kuroshio was
observed in the Kuroshio section. As a result, the
net transport of the Kuroshio at this time is
smaller than the mean value. For this reason, the
Kuroshio data obtained simultaneously with the
trans-Pacific hydrographic data is used initially to
determine the heat transport in order to minimize
the effect of this eddy. Climatological mean data
are used for estimating mass and temperature
transports of the surface Ekman flow (Hellerman
and Rosenstein, 1983; Levitus and Boyer, 1994b).
In this initial analysis, the mass and heat transports through the Bering Straits are ignored,
because the annual mean mass transport is fairly
small, i.e. only 0.810
9 kg s
91 (Coachman and
Aagaard, 1988). The net ocean heat transport
across 30°N is then estimated to be 0.62 PW.
The joining of time series western boundary
current measurements to a one-time transoceanic
section is a subtle issue still to be resolved. Should
only an instantaneous estimate of heat transport
be made for the particular time period when the
transoceanic section is made? Or can we join the
structure of the time-averaged western boundary
current onto a matching point in the transoceanic
section? As stated earlier, we prefer to emphasize
SECTION 6 LARGE-SCALE OCEAN TRANSPORTS
472
Table 6.1.4 Meridional heat transport across 30°N in the North Pacific
Mass
Temperature
Mean potential
Component
transport
transport
temperature
(10
9 kg s
91 )
(PW)
(°C)
Kuroshio
52.12
2.44
11.7
Tsushima current
2.2
0.14
16.0
Ekman transport
0.38
0.03
19.1
Interior
954.70
91.99
8.9
Baroclinic
925.46
91.61
15.8
Barotropic
929.24
90.38
3.2
Net
0.0
0.62
The Kuroshio south of Japan was measured along the ASUKA line during 19–22 January 1994
by RV Shoyo. The moored current meter measurements during this period were used to
choose the reference velocities for the geostrophic transport calculations. These estimates
are the net transports between the Japanese coast and 30°N, and not necessarily exclusively
for the northeastward-flowing Kuroshio.
The flow of the interior ocean is divided into baroclinic and barotropic components. The
baroclinic field was measured along 30°N during October 1993 and January 1994 by RV Shoyo,
Bosei-maru and Kaiyo-maru. The westernmost part of the section, connected to the ASUKA
line, was measured during 11–14 January 1994 by Kaiyo-maru. The barotropic mass transport
is calculated so that the net mass transport across the 30°N latitude circle is zero. The
barotropic temperature transport is estimated from this mass transport and the hydrographic
data.
For the Tsushima Current (Isobe, 1994) and Ekman transport (Hellerman and Rosenstein,
1983), climatological annual mean values are adopted.
Temperature transport is based on the Celsius scale. Mean potential temperature is
estimated by dividing the temperature transport by the mass transport and using C p as a
constant of 3.9910
3 J kg
91 °C
91
.