

WOCE, there is additional information on reference
level velocity from the sea surface height, underway
ADCP, drifter and float trajectories, as well as multiple geochemical tracer distributions. Most importantly, for the southern boundaries of the Indian
and Pacific, there are measurements of the western
boundary currents that have proven vital in the
past for constraining mid-ocean geostrophic calculations and ultimately the estimates of ocean heat
transport.
While the Indian and Pacific boundary current
measurements have not been completely analysed,
much progress has been made on the analysis of
heat transport across 30°N in the Pacific using a
combination of time series measurements of the
western boundary current and a transoceanic section. Thus, we conclude this chapter on ocean heat
transport with a summary of this recent analysis to
show the potential for combining different measurements made during WOCE to determine the
basin-scale circulation and heat transport.
The most comprehensive set of western boundary current measurements during WOCE were
made by Japanese scientists who deployed 33 current meters on nine moorings across the Kuroshio
south of Japan from October 1993 to November
1995 (Imawaki et al., 1997, 2000a). Hydrographic
surveys along the line of moorings were repeatedly
made during this 2-year intensive observation
period by the Affiliated Surveys of the Kuroshio
off Cape Ashizuri (ASUKA) Group. The velocity
field of the Kuroshio is determined by geostrophic
calculation using the repeated hydrographic survey
data referenced to velocities observed at mid and
abyssal depths. The mass and temperature transports for the Kuroshio between the Japanese coast
and 30°N are then estimated from these absolute
geostrophic velocities and hydrographic data. The
most complete surveys comprise four sets of
full-depth hydrographic data across the full extent
of the Kuroshio during the first year of the intensive survey period, when almost complete data
was recovered from the moored current meters.
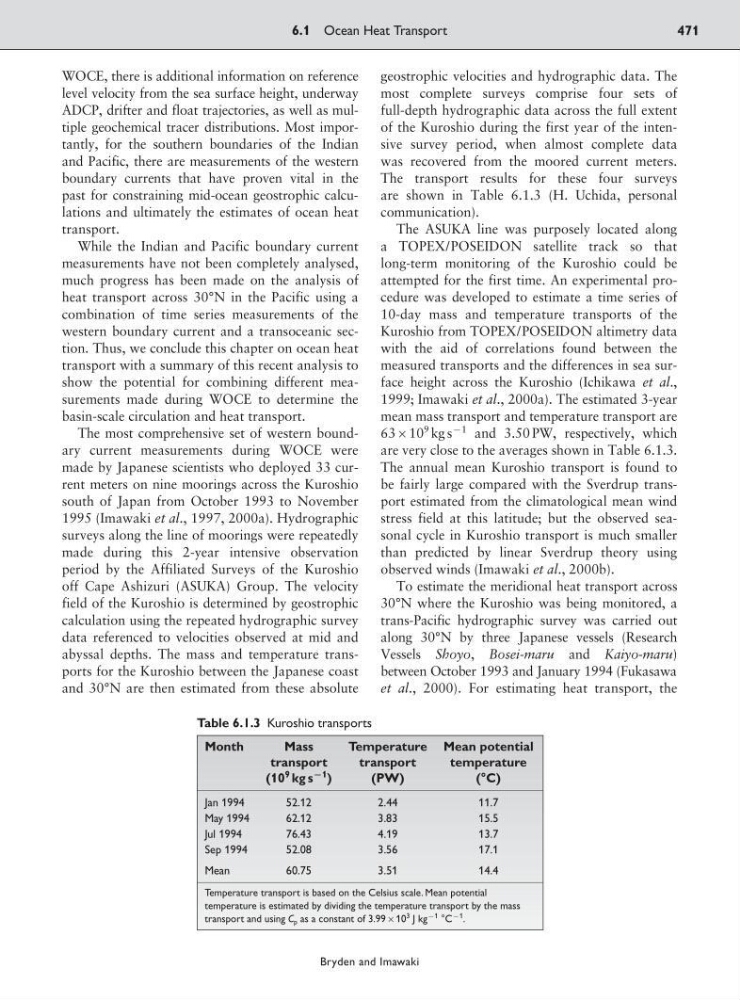
The transport results for these four surveys
are shown in Table 6.1.3 (H. Uchida, personal
communication).
The ASUKA line was purposely located along
a TOPEX/POSEIDON satellite track so that
long-term monitoring of the Kuroshio could be
attempted for the first time. An experimental procedure was developed to estimate a time series of
10-day mass and temperature transports of the
Kuroshio from TOPEX/POSEIDON altimetry data
with the aid of correlations found between the
measured transports and the differences in sea surface height across the Kuroshio (Ichikawa et al.,
1999; Imawaki et al., 2000a). The estimated 3-year
mean mass transport and temperature transport are
6310
9 kg s
91 and 3.50 PW, respectively, which
are very close to the averages shown in Table 6.1.3.
The annual mean Kuroshio transport is found to
be fairly large compared with the Sverdrup transport estimated from the climatological mean wind
stress field at this latitude; but the observed seasonal cycle in Kuroshio transport is much smaller
than predicted by linear Sverdrup theory using
observed winds (Imawaki et al., 2000b).
To estimate the meridional heat transport across
30°N where the Kuroshio was being monitored, a
trans-Pacific hydrographic survey was carried out
along 30°N by three Japanese vessels (Research
Vessels Shoyo, Bosei-maru and Kaiyo-maru)
between October 1993 and January 1994 (Fukasawa
et al., 2000). For estimating heat transport, the
6.1 Ocean Heat Transport
471
Bryden and Imawaki
Table 6.1.3 Kuroshio transports
Month
Mass
Temperature Mean potential
transport
transport
temperature
(10
9 kg s
91 )
(PW)
(°C)
Jan 1994
52.12
2.44
11.7
May 1994
62.12
3.83
15.5
Jul 1994
76.43
4.19
13.7
Sep 1994
52.08
3.56
17.1
Mean
60.75
3.51
14.4
Temperature transport is based on the Celsius scale. Mean potential
temperature is estimated by dividing the temperature transport by the mass
transport and using C p as a constant of 3.9910
3 J kg
91 °C
91 .
level velocity from the sea surface height, underway
ADCP, drifter and float trajectories, as well as multiple geochemical tracer distributions. Most importantly, for the southern boundaries of the Indian
and Pacific, there are measurements of the western
boundary currents that have proven vital in the
past for constraining mid-ocean geostrophic calculations and ultimately the estimates of ocean heat
transport.
While the Indian and Pacific boundary current
measurements have not been completely analysed,
much progress has been made on the analysis of
heat transport across 30°N in the Pacific using a
combination of time series measurements of the
western boundary current and a transoceanic section. Thus, we conclude this chapter on ocean heat
transport with a summary of this recent analysis to
show the potential for combining different measurements made during WOCE to determine the
basin-scale circulation and heat transport.
The most comprehensive set of western boundary current measurements during WOCE were
made by Japanese scientists who deployed 33 current meters on nine moorings across the Kuroshio
south of Japan from October 1993 to November
1995 (Imawaki et al., 1997, 2000a). Hydrographic
surveys along the line of moorings were repeatedly
made during this 2-year intensive observation
period by the Affiliated Surveys of the Kuroshio
off Cape Ashizuri (ASUKA) Group. The velocity
field of the Kuroshio is determined by geostrophic
calculation using the repeated hydrographic survey
data referenced to velocities observed at mid and
abyssal depths. The mass and temperature transports for the Kuroshio between the Japanese coast
and 30°N are then estimated from these absolute
geostrophic velocities and hydrographic data. The
most complete surveys comprise four sets of
full-depth hydrographic data across the full extent
of the Kuroshio during the first year of the intensive survey period, when almost complete data
was recovered from the moored current meters.
The transport results for these four surveys
are shown in Table 6.1.3 (H. Uchida, personal
communication).
The ASUKA line was purposely located along
a TOPEX/POSEIDON satellite track so that
long-term monitoring of the Kuroshio could be
attempted for the first time. An experimental procedure was developed to estimate a time series of
10-day mass and temperature transports of the
Kuroshio from TOPEX/POSEIDON altimetry data
with the aid of correlations found between the
measured transports and the differences in sea surface height across the Kuroshio (Ichikawa et al.,
1999; Imawaki et al., 2000a). The estimated 3-year
mean mass transport and temperature transport are
6310
9 kg s
91 and 3.50 PW, respectively, which
are very close to the averages shown in Table 6.1.3.
The annual mean Kuroshio transport is found to
be fairly large compared with the Sverdrup transport estimated from the climatological mean wind
stress field at this latitude; but the observed seasonal cycle in Kuroshio transport is much smaller
than predicted by linear Sverdrup theory using
observed winds (Imawaki et al., 2000b).
To estimate the meridional heat transport across
30°N where the Kuroshio was being monitored, a
trans-Pacific hydrographic survey was carried out
along 30°N by three Japanese vessels (Research
Vessels Shoyo, Bosei-maru and Kaiyo-maru)
between October 1993 and January 1994 (Fukasawa
et al., 2000). For estimating heat transport, the
6.1 Ocean Heat Transport
471
Bryden and Imawaki
Table 6.1.3 Kuroshio transports
Month
Mass
Temperature Mean potential
transport
transport
temperature
(10
9 kg s
91 )
(PW)
(°C)
Jan 1994
52.12
2.44
11.7
May 1994
62.12
3.83
15.5
Jul 1994
76.43
4.19
13.7
Sep 1994
52.08
3.56
17.1
Mean
60.75
3.51
14.4
Temperature transport is based on the Celsius scale. Mean potential
temperature is estimated by dividing the temperature transport by the mass
transport and using C p as a constant of 3.9910
3 J kg
91 °C
91 .