

circulation exhibits northward-flowing Antarctic
Bottom Water (AABW), southward-flowing North
Atlantic Deep Water (NADW) and northwardflowing Antarctic Intermediate Water (AAIW).
While the exact definition of water mass characteristics varies across these studies, there is a
remarkable consistency in the deep circulation
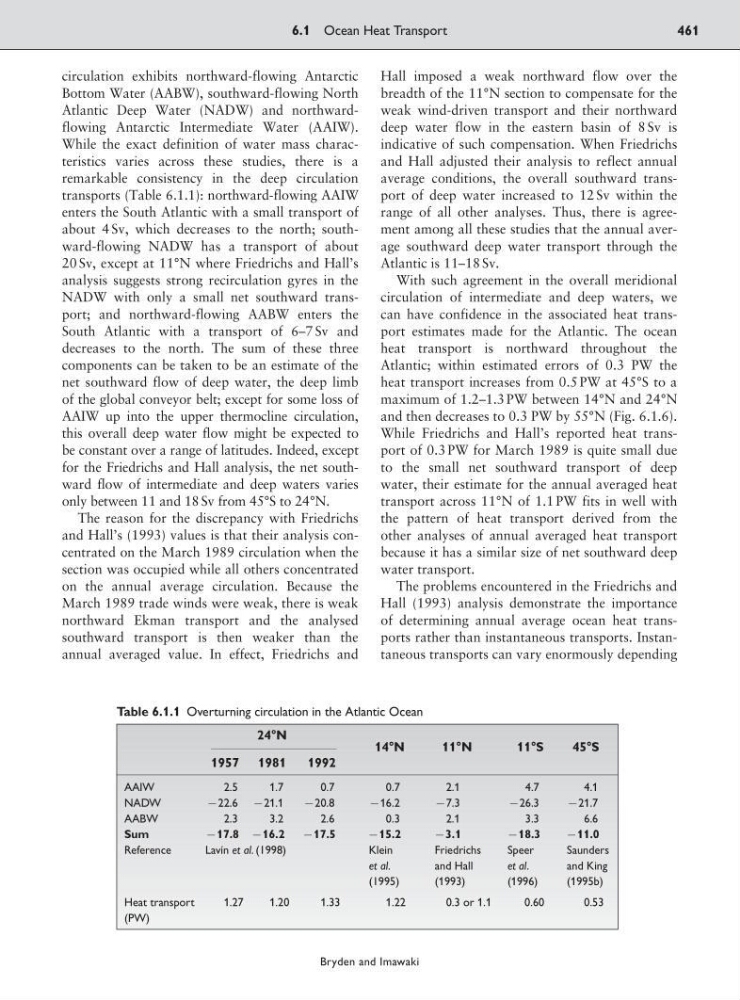
transports (Table 6.1.1): northward-flowing AAIW
enters the South Atlantic with a small transport of
about 4 Sv, which decreases to the north; southward-flowing NADW has a transport of about
20 Sv, except at 11°N where Friedrichs and Hall’s
analysis suggests strong recirculation gyres in the
NADW with only a small net southward transport; and northward-flowing AABW enters the
South Atlantic with a transport of 6–7 Sv and
decreases to the north. The sum of these three
components can be taken to be an estimate of the
net southward flow of deep water, the deep limb
of the global conveyor belt; except for some loss of
AAIW up into the upper thermocline circulation,
this overall deep water flow might be expected to
be constant over a range of latitudes. Indeed, except
for the Friedrichs and Hall analysis, the net southward flow of intermediate and deep waters varies
only between 11 and 18 Sv from 45°S to 24°N.
The reason for the discrepancy with Friedrichs
and Hall’s (1993) values is that their analysis concentrated on the March 1989 circulation when the
section was occupied while all others concentrated
on the annual average circulation. Because the
March 1989 trade winds were weak, there is weak
northward Ekman transport and the analysed
southward transport is then weaker than the
annual averaged value. In effect, Friedrichs and
Hall imposed a weak northward flow over the
breadth of the 11°N section to compensate for the
weak wind-driven transport and their northward
deep water flow in the eastern basin of 8 Sv is
indicative of such compensation. When Friedrichs
and Hall adjusted their analysis to reflect annual
average conditions, the overall southward transport of deep water increased to 12 Sv within the
range of all other analyses. Thus, there is agreement among all these studies that the annual average southward deep water transport through the
Atlantic is 11–18 Sv.
With such agreement in the overall meridional
circulation of intermediate and deep waters, we
can have confidence in the associated heat transport estimates made for the Atlantic. The ocean
heat transport is northward throughout the
Atlantic; within estimated errors of 0.3 PW the
heat transport increases from 0.5 PW at 45°S to a
maximum of 1.2–1.3 PW between 14°N and 24°N
and then decreases to 0.3 PW by 55°N (Fig. 6.1.6).
While Friedrichs and Hall’s reported heat transport of 0.3 PW for March 1989 is quite small due
to the small net southward transport of deep
water, their estimate for the annual averaged heat
transport across 11°N of 1.1 PW fits in well with
the pattern of heat transport derived from the
other analyses of annual averaged heat transport
because it has a similar size of net southward deep
water transport.
The problems encountered in the Friedrichs and
Hall (1993) analysis demonstrate the importance
of determining annual average ocean heat transports rather than instantaneous transports. Instantaneous transports can vary enormously depending
6.1 Ocean Heat Transport
461
Bryden and Imawaki
Table 6.1.1 Overturning circulation in the Atlantic Ocean
24°N
14°N
11°N
11°S
45°S
1957 1981
1992
AAIW
2.5
1.7
0.7
0.7
2.1
4.7
4.1
NADW
922.6 921.1
920.8
916.2
97.3
926.3
921.7
AABW
2.3
3.2
2.6
0.3
2.1
3.3
6.6
Sum
917.8 916.2 917.5
915.2
93.1
918.3
911.0
Reference
Lavín et al. (1998)
Klein
Friedrichs
Speer
Saunders
et al.
and Hall
et al.
and King
(1995)
(1993)
( 1996)
(1995b)
Heat transport
1.27
1.20
1.33
1.22
0.3 or 1.1
0.60
0.53
(PW)
Bottom Water (AABW), southward-flowing North
Atlantic Deep Water (NADW) and northwardflowing Antarctic Intermediate Water (AAIW).
While the exact definition of water mass characteristics varies across these studies, there is a
remarkable consistency in the deep circulation
transports (Table 6.1.1): northward-flowing AAIW
enters the South Atlantic with a small transport of
about 4 Sv, which decreases to the north; southward-flowing NADW has a transport of about
20 Sv, except at 11°N where Friedrichs and Hall’s
analysis suggests strong recirculation gyres in the
NADW with only a small net southward transport; and northward-flowing AABW enters the
South Atlantic with a transport of 6–7 Sv and
decreases to the north. The sum of these three
components can be taken to be an estimate of the
net southward flow of deep water, the deep limb
of the global conveyor belt; except for some loss of
AAIW up into the upper thermocline circulation,
this overall deep water flow might be expected to
be constant over a range of latitudes. Indeed, except
for the Friedrichs and Hall analysis, the net southward flow of intermediate and deep waters varies
only between 11 and 18 Sv from 45°S to 24°N.
The reason for the discrepancy with Friedrichs
and Hall’s (1993) values is that their analysis concentrated on the March 1989 circulation when the
section was occupied while all others concentrated
on the annual average circulation. Because the
March 1989 trade winds were weak, there is weak
northward Ekman transport and the analysed
southward transport is then weaker than the
annual averaged value. In effect, Friedrichs and
Hall imposed a weak northward flow over the
breadth of the 11°N section to compensate for the
weak wind-driven transport and their northward
deep water flow in the eastern basin of 8 Sv is
indicative of such compensation. When Friedrichs
and Hall adjusted their analysis to reflect annual
average conditions, the overall southward transport of deep water increased to 12 Sv within the
range of all other analyses. Thus, there is agreement among all these studies that the annual average southward deep water transport through the
Atlantic is 11–18 Sv.
With such agreement in the overall meridional
circulation of intermediate and deep waters, we
can have confidence in the associated heat transport estimates made for the Atlantic. The ocean
heat transport is northward throughout the
Atlantic; within estimated errors of 0.3 PW the
heat transport increases from 0.5 PW at 45°S to a
maximum of 1.2–1.3 PW between 14°N and 24°N
and then decreases to 0.3 PW by 55°N (Fig. 6.1.6).
While Friedrichs and Hall’s reported heat transport of 0.3 PW for March 1989 is quite small due
to the small net southward transport of deep
water, their estimate for the annual averaged heat
transport across 11°N of 1.1 PW fits in well with
the pattern of heat transport derived from the
other analyses of annual averaged heat transport
because it has a similar size of net southward deep
water transport.
The problems encountered in the Friedrichs and
Hall (1993) analysis demonstrate the importance
of determining annual average ocean heat transports rather than instantaneous transports. Instantaneous transports can vary enormously depending
6.1 Ocean Heat Transport
461
Bryden and Imawaki
Table 6.1.1 Overturning circulation in the Atlantic Ocean
24°N
14°N
11°N
11°S
45°S
1957 1981
1992
AAIW
2.5
1.7
0.7
0.7
2.1
4.7
4.1
NADW
922.6 921.1
920.8
916.2
97.3
926.3
921.7
AABW
2.3
3.2
2.6
0.3
2.1
3.3
6.6
Sum
917.8 916.2 917.5
915.2
93.1
918.3
911.0
Reference
Lavín et al. (1998)
Klein
Friedrichs
Speer
Saunders
et al.
and Hall
et al.
and King
(1995)
(1993)
( 1996)
(1995b)
Heat transport
1.27
1.20
1.33
1.22
0.3 or 1.1
0.60
0.53
(PW)