

is approximately 0.05 yr km
91 for both 30°S to
10°S and 30°N to 10°N. This gradient corresponds to a mean meridional velocity of about
710
93 m s
91
. In general, the
3 H/
3
He age for the
density range 26.0: :26.5 starts at about 5–10
years in the subtropics (a reflection of the ventilation time scale of these waters within the subtropics) and increases to 15–20 years in the tropics. If
interpreted in a straightforward manner, the
advective time scale for the tongue would appear
to be close to 10 years, but considerable caution
must be exercised in the presence of mixing (e.g.
see Jenkins, 1998). Further, more quantitative
interpretation would require a more complete modelling of the tracer distributions and evolution.
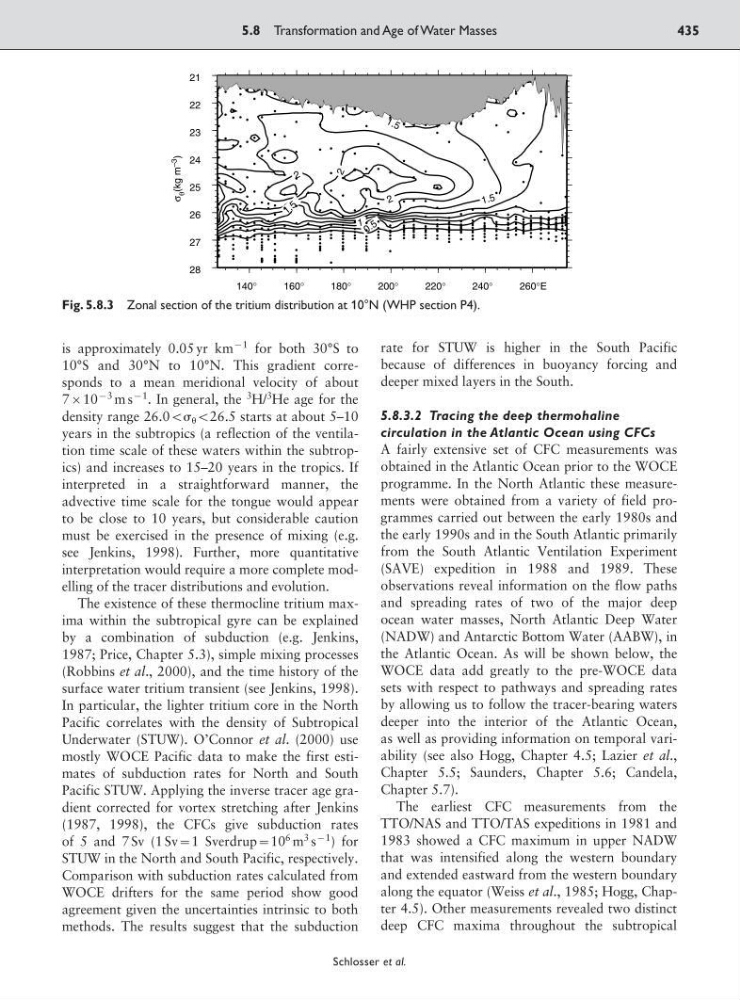
The existence of these thermocline tritium maxima within the subtropical gyre can be explained
by a combination of subduction (e.g. Jenkins,
1987; Price, Chapter 5.3), simple mixing processes
(Robbins et al., 2000), and the time history of the
surface water tritium transient (see Jenkins, 1998).
In particular, the lighter tritium core in the North
Pacific correlates with the density of Subtropical
Underwater (STUW). O’Connor et al. (2000) use
mostly WOCE Pacific data to make the first estimates of subduction rates for North and South
Pacific STUW. Applying the inverse tracer age gradient corrected for vortex stretching after Jenkins
(1987, 1998), the CFCs give subduction rates
of 5 and 7 Sv (1 Sv:1 Sverdrup:10
6 m
3 s
91
) for
STUW in the North and South Pacific, respectively.
Comparison with subduction rates calculated from
WOCE drifters for the same period show good
agreement given the uncertainties intrinsic to both
methods. The results suggest that the subduction
rate for STUW is higher in the South Pacific
because of differences in buoyancy forcing and
deeper mixed layers in the South.
5.8.3.2 Tracing the deep thermohaline
circulation in the Atlantic Ocean using CFCs
A fairly extensive set of CFC measurements was
obtained in the Atlantic Ocean prior to the WOCE
programme. In the North Atlantic these measurements were obtained from a variety of field programmes carried out between the early 1980s and
the early 1990s and in the South Atlantic primarily
from the South Atlantic Ventilation Experiment
(SAVE) expedition in 1988 and 1989. These
observations reveal information on the flow paths
and spreading rates of two of the major deep
ocean water masses, North Atlantic Deep Water
(NADW) and Antarctic Bottom Water (AABW), in
the Atlantic Ocean. As will be shown below, the
WOCE data add greatly to the pre-WOCE data
sets with respect to pathways and spreading rates
by allowing us to follow the tracer-bearing waters
deeper into the interior of the Atlantic Ocean,
as well as providing information on temporal variability (see also Hogg, Chapter 4.5; Lazier et al.,
Chapter 5.5; Saunders, Chapter 5.6; Candela,
Chapter 5.7).
The earliest CFC measurements from the
TTO/NAS and TTO/TAS expeditions in 1981 and
1983 showed a CFC maximum in upper NADW
that was intensified along the western boundary
and extended eastward from the western boundary
along the equator (Weiss et al., 1985; Hogg, Chapter 4.5). Other measurements revealed two distinct
deep CFC maxima throughout the subtropical
5.8 Transformation and Age of Water Masses
435
Schlosser et al.
0 . 5
1
1 .5
1 . 5
1 .5
1.5
2
2
2
21
22
23
24
25
26
27
28
140°
160°
180°
200°
220°
240°
260°E
σ
θ (kg m
–3
)
Fig. 5.8.3 Zonal section of the tritium distribution at 10°N (WHP section P4).
91 for both 30°S to
10°S and 30°N to 10°N. This gradient corresponds to a mean meridional velocity of about
710
93 m s
91
. In general, the
3 H/
3
He age for the
density range 26.0: :26.5 starts at about 5–10
years in the subtropics (a reflection of the ventilation time scale of these waters within the subtropics) and increases to 15–20 years in the tropics. If
interpreted in a straightforward manner, the
advective time scale for the tongue would appear
to be close to 10 years, but considerable caution
must be exercised in the presence of mixing (e.g.
see Jenkins, 1998). Further, more quantitative
interpretation would require a more complete modelling of the tracer distributions and evolution.
The existence of these thermocline tritium maxima within the subtropical gyre can be explained
by a combination of subduction (e.g. Jenkins,
1987; Price, Chapter 5.3), simple mixing processes
(Robbins et al., 2000), and the time history of the
surface water tritium transient (see Jenkins, 1998).
In particular, the lighter tritium core in the North
Pacific correlates with the density of Subtropical
Underwater (STUW). O’Connor et al. (2000) use
mostly WOCE Pacific data to make the first estimates of subduction rates for North and South
Pacific STUW. Applying the inverse tracer age gradient corrected for vortex stretching after Jenkins
(1987, 1998), the CFCs give subduction rates
of 5 and 7 Sv (1 Sv:1 Sverdrup:10
6 m
3 s
91
) for
STUW in the North and South Pacific, respectively.
Comparison with subduction rates calculated from
WOCE drifters for the same period show good
agreement given the uncertainties intrinsic to both
methods. The results suggest that the subduction
rate for STUW is higher in the South Pacific
because of differences in buoyancy forcing and
deeper mixed layers in the South.
5.8.3.2 Tracing the deep thermohaline
circulation in the Atlantic Ocean using CFCs
A fairly extensive set of CFC measurements was
obtained in the Atlantic Ocean prior to the WOCE
programme. In the North Atlantic these measurements were obtained from a variety of field programmes carried out between the early 1980s and
the early 1990s and in the South Atlantic primarily
from the South Atlantic Ventilation Experiment
(SAVE) expedition in 1988 and 1989. These
observations reveal information on the flow paths
and spreading rates of two of the major deep
ocean water masses, North Atlantic Deep Water
(NADW) and Antarctic Bottom Water (AABW), in
the Atlantic Ocean. As will be shown below, the
WOCE data add greatly to the pre-WOCE data
sets with respect to pathways and spreading rates
by allowing us to follow the tracer-bearing waters
deeper into the interior of the Atlantic Ocean,
as well as providing information on temporal variability (see also Hogg, Chapter 4.5; Lazier et al.,
Chapter 5.5; Saunders, Chapter 5.6; Candela,
Chapter 5.7).
The earliest CFC measurements from the
TTO/NAS and TTO/TAS expeditions in 1981 and
1983 showed a CFC maximum in upper NADW
that was intensified along the western boundary
and extended eastward from the western boundary
along the equator (Weiss et al., 1985; Hogg, Chapter 4.5). Other measurements revealed two distinct
deep CFC maxima throughout the subtropical
5.8 Transformation and Age of Water Masses
435
Schlosser et al.
0 . 5
1
1 .5
1 . 5
1 .5
1.5
2
2
2
21
22
23
24
25
26
27
28
140°
160°
180°
200°
220°
240°
260°E
σ
θ (kg m
–3
)
Fig. 5.8.3 Zonal section of the tritium distribution at 10°N (WHP section P4).