

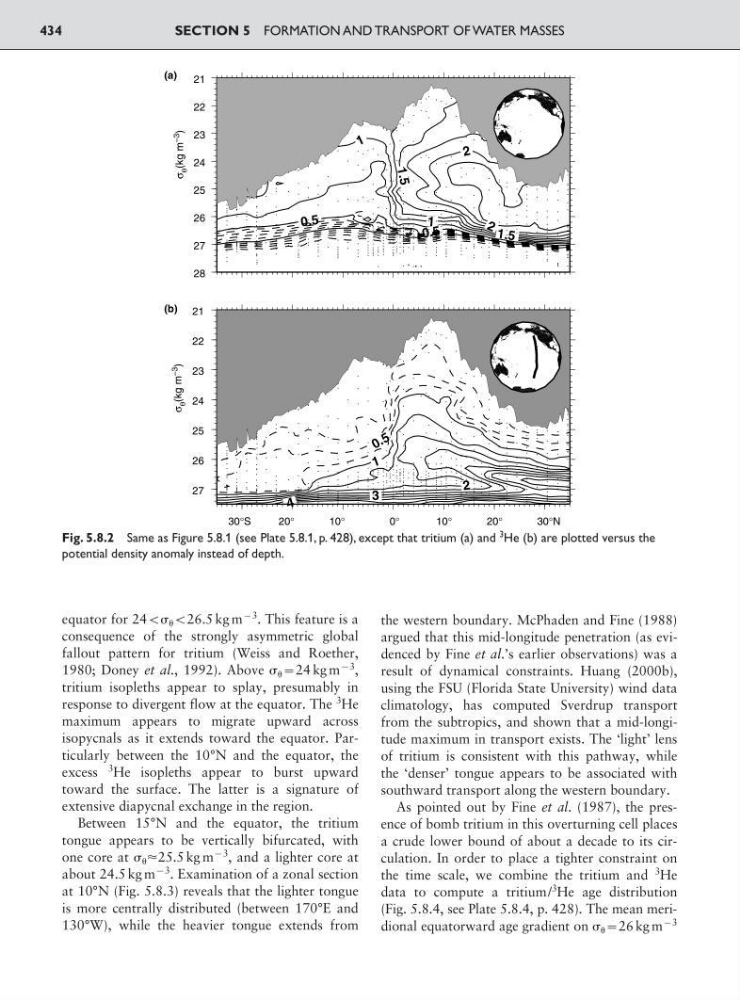
equator for 24: :26.5 kg m
93 . This feature is a
consequence of the strongly asymmetric global
fallout pattern for tritium (Weiss and Roether,
1980; Doney et al., 1992). Above :24 kg m
93
,
tritium isopleths appear to splay, presumably in
response to divergent flow at the equator. The
3
He
maximum appears to migrate upward across
isopycnals as it extends toward the equator. Particularly between the 10°N and the equator, the
excess
3
He isopleths appear to burst upward
toward the surface. The latter is a signature of
extensive diapycnal exchange in the region.
Between 15°N and the equator, the tritium
tongue appears to be vertically bifurcated, with
one core at Ϸ25.5 kg m
93
, and a lighter core at
about 24.5 kg m
93 . Examination of a zonal section
at 10°N (Fig. 5.8.3) reveals that the lighter tongue
is more centrally distributed (between 170°E and
130°W), while the heavier tongue extends from
the western boundary. McPhaden and Fine (1988)
argued that this mid-longitude penetration (as evidenced by Fine et al.’s earlier observations) was a
result of dynamical constraints. Huang (2000b),
using the FSU (Florida State University) wind data
climatology, has computed Sverdrup transport
from the subtropics, and shown that a mid-longitude maximum in transport exists. The ‘light’ lens
of tritium is consistent with this pathway, while
the ‘denser’ tongue appears to be associated with
southward transport along the western boundary.
As pointed out by Fine et al. (1987), the presence of bomb tritium in this overturning cell places
a crude lower bound of about a decade to its circulation. In order to place a tighter constraint on
the time scale, we combine the tritium and
3
He
data to compute a tritium/
3 He age distribution
(Fig. 5.8.4, see Plate 5.8.4, p. 428). The mean meridional equatorward age gradient on :26 kg m
93
SECTION 5 FORMATION AND TRANSPORT OF WATER MASSES
434
1
2
3
4
0 . 5
21
22
23
24
25
26
27
30°S
20°
10°
0°
10°
20°
30°N
0. 5
0. 5
1
1
1
1 .5
1. 5
2
2
21
22
23
24
25
26
27
28
(a)
(b)
σ
θ
(kg m
–3
)
σ
θ
(kg m
–3
)
Fig. 5.8.2 Same as Figure 5.8.1 (see Plate 5.8.1, p. 428), except that tritium (a) and
3
He (b) are plotted versus the
potential density anomaly instead of depth.
93 . This feature is a
consequence of the strongly asymmetric global
fallout pattern for tritium (Weiss and Roether,
1980; Doney et al., 1992). Above :24 kg m
93
,
tritium isopleths appear to splay, presumably in
response to divergent flow at the equator. The
3
He
maximum appears to migrate upward across
isopycnals as it extends toward the equator. Particularly between the 10°N and the equator, the
excess
3
He isopleths appear to burst upward
toward the surface. The latter is a signature of
extensive diapycnal exchange in the region.
Between 15°N and the equator, the tritium
tongue appears to be vertically bifurcated, with
one core at Ϸ25.5 kg m
93
, and a lighter core at
about 24.5 kg m
93 . Examination of a zonal section
at 10°N (Fig. 5.8.3) reveals that the lighter tongue
is more centrally distributed (between 170°E and
130°W), while the heavier tongue extends from
the western boundary. McPhaden and Fine (1988)
argued that this mid-longitude penetration (as evidenced by Fine et al.’s earlier observations) was a
result of dynamical constraints. Huang (2000b),
using the FSU (Florida State University) wind data
climatology, has computed Sverdrup transport
from the subtropics, and shown that a mid-longitude maximum in transport exists. The ‘light’ lens
of tritium is consistent with this pathway, while
the ‘denser’ tongue appears to be associated with
southward transport along the western boundary.
As pointed out by Fine et al. (1987), the presence of bomb tritium in this overturning cell places
a crude lower bound of about a decade to its circulation. In order to place a tighter constraint on
the time scale, we combine the tritium and
3
He
data to compute a tritium/
3 He age distribution
(Fig. 5.8.4, see Plate 5.8.4, p. 428). The mean meridional equatorward age gradient on :26 kg m
93
SECTION 5 FORMATION AND TRANSPORT OF WATER MASSES
434
1
2
3
4
0 . 5
21
22
23
24
25
26
27
30°S
20°
10°
0°
10°
20°
30°N
0. 5
0. 5
1
1
1
1 .5
1. 5
2
2
21
22
23
24
25
26
27
28
(a)
(b)
σ
θ
(kg m
–3
)
σ
θ
(kg m
–3
)
Fig. 5.8.2 Same as Figure 5.8.1 (see Plate 5.8.1, p. 428), except that tritium (a) and
3
He (b) are plotted versus the
potential density anomaly instead of depth.