

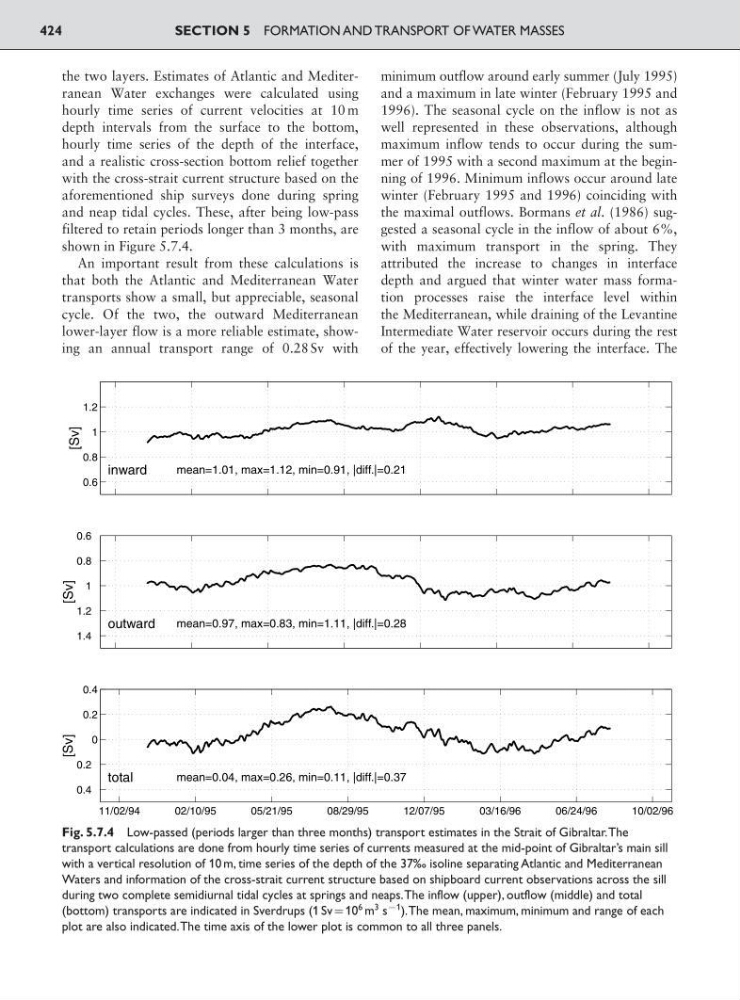
the two layers. Estimates of Atlantic and Mediterranean Water exchanges were calculated using
hourly time series of current velocities at 10 m
depth intervals from the surface to the bottom,
hourly time series of the depth of the interface,
and a realistic cross-section bottom relief together
with the cross-strait current structure based on the
aforementioned ship surveys done during spring
and neap tidal cycles. These, after being low-pass
filtered to retain periods longer than 3 months, are
shown in Figure 5.7.4.
An important result from these calculations is
that both the Atlantic and Mediterranean Water
transports show a small, but appreciable, seasonal
cycle. Of the two, the outward Mediterranean
lower-layer flow is a more reliable estimate, showing an annual transport range of 0.28 Sv with
minimum outflow around early summer (July 1995)
and a maximum in late winter (February 1995 and
1996). The seasonal cycle on the inflow is not as
well represented in these observations, although
maximum inflow tends to occur during the summer of 1995 with a second maximum at the beginning of 1996. Minimum inflows occur around late
winter (February 1995 and 1996) coinciding with
the maximal outflows. Bormans et al. (1986) suggested a seasonal cycle in the inflow of about 6%,
with maximum transport in the spring. They
attributed the increase to changes in interface
depth and argued that winter water mass formation processes raise the interface level within
the Mediterranean, while draining of the Levantine
Intermediate Water reservoir occurs during the rest
of the year, effectively lowering the interface. The
SECTION 5 FORMATION AND TRANSPORT OF WATER MASSES
424
0.6
0.8
1
1.2
mean=1.01, max=1.12, min=0.91, |diff.|=0.21
inward
[Sv]
1.4
1.2
1
0.8
0.6
mean=0.97, max=0.83, min=1.11, |diff.|=0.28
outward
[Sv]
11/02/94
02/10/95
05/21/95
08/29/95
12/07/95
03/16/96
06/24/96
10/02/96
0.4
0.2
0
0.2
0.4
mean=0.04, max=0.26, min=0.11, |diff.|=0.37
total
[Sv]
Fig. 5.7.4 Low-passed (periods larger than three months) transport estimates in the Strait of Gibraltar.The
transport calculations are done from hourly time series of currents measured at the mid-point of Gibraltar’s main sill
with a vertical resolution of 10 m, time series of the depth of the 37‰ isoline separating Atlantic and Mediterranean
Waters and information of the cross-strait current structure based on shipboard current observations across the sill
during two complete semidiurnal tidal cycles at springs and neaps.The inflow (upper), outflow (middle) and total
(bottom) transports are indicated in Sverdrups (1 Sv:10
6 m
3 s
91 ).The mean, maximum, minimum and range of each
plot are also indicated.The time axis of the lower plot is common to all three panels.
hourly time series of current velocities at 10 m
depth intervals from the surface to the bottom,
hourly time series of the depth of the interface,
and a realistic cross-section bottom relief together
with the cross-strait current structure based on the
aforementioned ship surveys done during spring
and neap tidal cycles. These, after being low-pass
filtered to retain periods longer than 3 months, are
shown in Figure 5.7.4.
An important result from these calculations is
that both the Atlantic and Mediterranean Water
transports show a small, but appreciable, seasonal
cycle. Of the two, the outward Mediterranean
lower-layer flow is a more reliable estimate, showing an annual transport range of 0.28 Sv with
minimum outflow around early summer (July 1995)
and a maximum in late winter (February 1995 and
1996). The seasonal cycle on the inflow is not as
well represented in these observations, although
maximum inflow tends to occur during the summer of 1995 with a second maximum at the beginning of 1996. Minimum inflows occur around late
winter (February 1995 and 1996) coinciding with
the maximal outflows. Bormans et al. (1986) suggested a seasonal cycle in the inflow of about 6%,
with maximum transport in the spring. They
attributed the increase to changes in interface
depth and argued that winter water mass formation processes raise the interface level within
the Mediterranean, while draining of the Levantine
Intermediate Water reservoir occurs during the rest
of the year, effectively lowering the interface. The
SECTION 5 FORMATION AND TRANSPORT OF WATER MASSES
424
0.6
0.8
1
1.2
mean=1.01, max=1.12, min=0.91, |diff.|=0.21
inward
[Sv]
1.4
1.2
1
0.8
0.6
mean=0.97, max=0.83, min=1.11, |diff.|=0.28
outward
[Sv]
11/02/94
02/10/95
05/21/95
08/29/95
12/07/95
03/16/96
06/24/96
10/02/96
0.4
0.2
0
0.2
0.4
mean=0.04, max=0.26, min=0.11, |diff.|=0.37
total
[Sv]
Fig. 5.7.4 Low-passed (periods larger than three months) transport estimates in the Strait of Gibraltar.The
transport calculations are done from hourly time series of currents measured at the mid-point of Gibraltar’s main sill
with a vertical resolution of 10 m, time series of the depth of the 37‰ isoline separating Atlantic and Mediterranean
Waters and information of the cross-strait current structure based on shipboard current observations across the sill
during two complete semidiurnal tidal cycles at springs and neaps.The inflow (upper), outflow (middle) and total
(bottom) transports are indicated in Sverdrups (1 Sv:10
6 m
3 s
91 ).The mean, maximum, minimum and range of each
plot are also indicated.The time axis of the lower plot is common to all three panels.