

by horizontal diffusion across sloping isopycnals. In
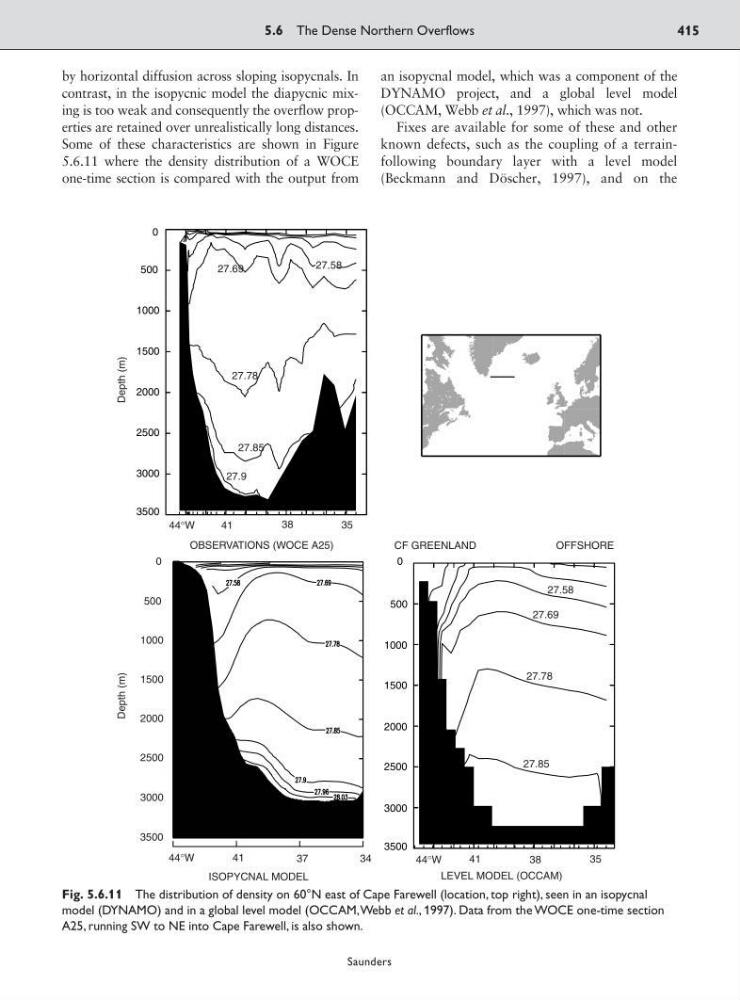
contrast, in the isopycnic model the diapycnic mixing is too weak and consequently the overflow properties are retained over unrealistically long distances.
Some of these characteristics are shown in Figure
5.6.11 where the density distribution of a WOCE
one-time section is compared with the output from
an isopycnal model, which was a component of the
DYNAMO project, and a global level model
(OCCAM, Webb et al., 1997), which was not.
Fixes are available for some of these and other
known defects, such as the coupling of a terrainfollowing boundary layer with a level model
(Beckmann and Döscher, 1997), and on the
5.6 The Dense Northern Overflows
415
Saunders
3500
3000
2500
2000
1500
1000
500
0
3500
3000
2500
2000
1500
1000
500
0
LEVEL MODEL (OCCAM)
ISOPYCNAL MODEL
OBSERVATIONS (WOCE A25)
27.69
27.78
27.85
27.9
27.58
27.85
27.78
27.69
27.58
44°W
4 1
38
35
35
41
38
44°W
41
37
34
44°W
CF GREENLAND
OFFSHORE
0
500
1000
1500
2000
2500
3000
3500
Depth (m)
Depth (m)
Fig. 5.6.11 The distribution of density on 60°N east of Cape Farewell (location, top right), seen in an isopycnal
model (DYNAMO) and in a global level model (OCCAM,Webb et al., 1997). Data from the WOCE one-time section
A25, running SW to NE into Cape Farewell, is also shown.
contrast, in the isopycnic model the diapycnic mixing is too weak and consequently the overflow properties are retained over unrealistically long distances.
Some of these characteristics are shown in Figure
5.6.11 where the density distribution of a WOCE
one-time section is compared with the output from
an isopycnal model, which was a component of the
DYNAMO project, and a global level model
(OCCAM, Webb et al., 1997), which was not.
Fixes are available for some of these and other
known defects, such as the coupling of a terrainfollowing boundary layer with a level model
(Beckmann and Döscher, 1997), and on the
5.6 The Dense Northern Overflows
415
Saunders
3500
3000
2500
2000
1500
1000
500
0
3500
3000
2500
2000
1500
1000
500
0
LEVEL MODEL (OCCAM)
ISOPYCNAL MODEL
OBSERVATIONS (WOCE A25)
27.69
27.78
27.85
27.9
27.58
27.85
27.78
27.69
27.58
44°W
4 1
38
35
35
41
38
44°W
41
37
34
44°W
CF GREENLAND
OFFSHORE
0
500
1000
1500
2000
2500
3000
3500
Depth (m)
Depth (m)
Fig. 5.6.11 The distribution of density on 60°N east of Cape Farewell (location, top right), seen in an isopycnal
model (DYNAMO) and in a global level model (OCCAM,Webb et al., 1997). Data from the WOCE one-time section
A25, running SW to NE into Cape Farewell, is also shown.