

The region between 400 and 600 km region is
where convection has been observed to reach its
greatest depth in winter. This was most recently
observed during the February 1997 Knorr survey
of the Labrador Sea, when the deepest mixed layer
along the CTD line across the Labrador Sea, shown
in Figure 5.5.1, was 1100 m at the 3000 m isobath
on the Labrador side, 700 m in the centre of the
basin, and 200 m at the 3000 m isobath on the
Greenland side (Lab Sea Group, 1998, Fig. 16).
These observed isopycnal depth changes reflect a
slow adjustment following convection. Lighter
water, from beyond the region of deepest convection, moves into the upper water column in the
region of deepest convection, while denser water in
the region of deepest convection moves outward
at mid-depth. Eddy diffusion appears to be the
primary reason for these changes.
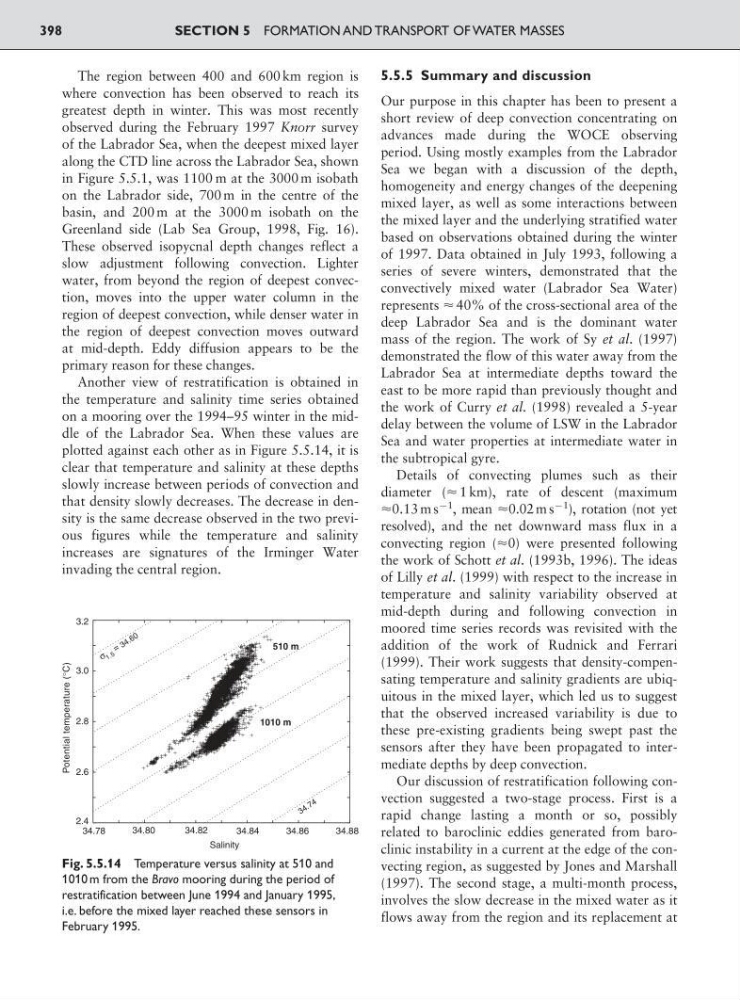
Another view of restratification is obtained in
the temperature and salinity time series obtained
on a mooring over the 1994–95 winter in the middle of the Labrador Sea. When these values are
plotted against each other as in Figure 5.5.14, it is
clear that temperature and salinity at these depths
slowly increase between periods of convection and
that density slowly decreases. The decrease in density is the same decrease observed in the two previous figures while the temperature and salinity
increases are signatures of the Irminger Water
invading the central region.
5.5.5 Summary and discussion
Our purpose in this chapter has been to present a
short review of deep convection concentrating on
advances made during the WOCE observing
period. Using mostly examples from the Labrador
Sea we began with a discussion of the depth,
homogeneity and energy changes of the deepening
mixed layer, as well as some interactions between
the mixed layer and the underlying stratified water
based on observations obtained during the winter
of 1997. Data obtained in July 1993, following a
series of severe winters, demonstrated that the
convectively mixed water (Labrador Sea Water)
represents Ϸ 40% of the cross-sectional area of the
deep Labrador Sea and is the dominant water
mass of the region. The work of Sy et al. (1997)
demonstrated the flow of this water away from the
Labrador Sea at intermediate depths toward the
east to be more rapid than previously thought and
the work of Curry et al. (1998) revealed a 5-year
delay between the volume of LSW in the Labrador
Sea and water properties at intermediate water in
the subtropical gyre.
Details of convecting plumes such as their
diameter (Ϸ 1 km), rate of descent (maximum
Ϸ0.13 m s
91
, mean Ϸ0.02 m s
91
), rotation (not yet
resolved), and the net downward mass flux in a
convecting region (Ϸ0) were presented following
the work of Schott et al. (1993b, 1996). The ideas
of Lilly et al. (1999) with respect to the increase in
temperature and salinity variability observed at
mid-depth during and following convection in
moored time series records was revisited with the
addition of the work of Rudnick and Ferrari
(1999). Their work suggests that density-compensating temperature and salinity gradients are ubiquitous in the mixed layer, which led us to suggest
that the observed increased variability is due to
these pre-existing gradients being swept past the
sensors after they have been propagated to intermediate depths by deep convection.
Our discussion of restratification following convection suggested a two-stage process. First is a
rapid change lasting a month or so, possibly
related to baroclinic eddies generated from baroclinic instability in a current at the edge of the convecting region, as suggested by Jones and Marshall
(1997). The second stage, a multi-month process,
involves the slow decrease in the mixed water as it
flows away from the region and its replacement at
SECTION 5 FORMATION AND TRANSPORT OF WATER MASSES
398
34.78
34.80
34.82
34.84
34.86
34.88
2.4
2.6
2.8
3.0
3.2
Salinity
σ 1 .5
=
3 4 .7 4
3 4 .6 0
510 m
1010 m
Potential temperature (°C)
Fig. 5.5.14 Temperature versus salinity at 510 and
1010 m from the Bravo mooring during the period of
restratification between June 1994 and January 1995,
i.e. before the mixed layer reached these sensors in
February 1995.
where convection has been observed to reach its
greatest depth in winter. This was most recently
observed during the February 1997 Knorr survey
of the Labrador Sea, when the deepest mixed layer
along the CTD line across the Labrador Sea, shown
in Figure 5.5.1, was 1100 m at the 3000 m isobath
on the Labrador side, 700 m in the centre of the
basin, and 200 m at the 3000 m isobath on the
Greenland side (Lab Sea Group, 1998, Fig. 16).
These observed isopycnal depth changes reflect a
slow adjustment following convection. Lighter
water, from beyond the region of deepest convection, moves into the upper water column in the
region of deepest convection, while denser water in
the region of deepest convection moves outward
at mid-depth. Eddy diffusion appears to be the
primary reason for these changes.
Another view of restratification is obtained in
the temperature and salinity time series obtained
on a mooring over the 1994–95 winter in the middle of the Labrador Sea. When these values are
plotted against each other as in Figure 5.5.14, it is
clear that temperature and salinity at these depths
slowly increase between periods of convection and
that density slowly decreases. The decrease in density is the same decrease observed in the two previous figures while the temperature and salinity
increases are signatures of the Irminger Water
invading the central region.
5.5.5 Summary and discussion
Our purpose in this chapter has been to present a
short review of deep convection concentrating on
advances made during the WOCE observing
period. Using mostly examples from the Labrador
Sea we began with a discussion of the depth,
homogeneity and energy changes of the deepening
mixed layer, as well as some interactions between
the mixed layer and the underlying stratified water
based on observations obtained during the winter
of 1997. Data obtained in July 1993, following a
series of severe winters, demonstrated that the
convectively mixed water (Labrador Sea Water)
represents Ϸ 40% of the cross-sectional area of the
deep Labrador Sea and is the dominant water
mass of the region. The work of Sy et al. (1997)
demonstrated the flow of this water away from the
Labrador Sea at intermediate depths toward the
east to be more rapid than previously thought and
the work of Curry et al. (1998) revealed a 5-year
delay between the volume of LSW in the Labrador
Sea and water properties at intermediate water in
the subtropical gyre.
Details of convecting plumes such as their
diameter (Ϸ 1 km), rate of descent (maximum
Ϸ0.13 m s
91
, mean Ϸ0.02 m s
91
), rotation (not yet
resolved), and the net downward mass flux in a
convecting region (Ϸ0) were presented following
the work of Schott et al. (1993b, 1996). The ideas
of Lilly et al. (1999) with respect to the increase in
temperature and salinity variability observed at
mid-depth during and following convection in
moored time series records was revisited with the
addition of the work of Rudnick and Ferrari
(1999). Their work suggests that density-compensating temperature and salinity gradients are ubiquitous in the mixed layer, which led us to suggest
that the observed increased variability is due to
these pre-existing gradients being swept past the
sensors after they have been propagated to intermediate depths by deep convection.
Our discussion of restratification following convection suggested a two-stage process. First is a
rapid change lasting a month or so, possibly
related to baroclinic eddies generated from baroclinic instability in a current at the edge of the convecting region, as suggested by Jones and Marshall
(1997). The second stage, a multi-month process,
involves the slow decrease in the mixed water as it
flows away from the region and its replacement at
SECTION 5 FORMATION AND TRANSPORT OF WATER MASSES
398
34.78
34.80
34.82
34.84
34.86
34.88
2.4
2.6
2.8
3.0
3.2
Salinity
σ 1 .5
=
3 4 .7 4
3 4 .6 0
510 m
1010 m
Potential temperature (°C)
Fig. 5.5.14 Temperature versus salinity at 510 and
1010 m from the Bravo mooring during the period of
restratification between June 1994 and January 1995,
i.e. before the mixed layer reached these sensors in
February 1995.