

SECTION 5 FORMATION AND TRANSPORT OF WATER MASSES
388
W W W e e e s s s t t t G G G r r r e e e e e e n n n l l la a a n n n d d d
C C C
. . .
C A ND A
CANADA
G R E E N LA N D
GREENLAND
E E E
a a a s s s t t t G G G r r r e e e e e e n n n l l l a a a n n n d d d C C C u u u r r r r r r e e e n n n t t t
B B B a a a f f ff f fi i in n n I I Is s sl
l la
a an
n nd
d d
C C C
. . .
I I I r r r
m
i n g e e e r r r C C C
. . .
L
a
b r a d o
r
C
u
r
r
e
n
t
L
ICELAND
1000m
2000m
Sea
Labrador
mooring
Irminger
Sea
D e n m a r k S t r a it
Iceland
Basin
R
o c k a l l
T r o u g h
Newfoundland
Basin
70°N
65°
60°
60°
55°
50°
50°
45°
40°
40°
70°W
3 0 °
20°
10°
0 °
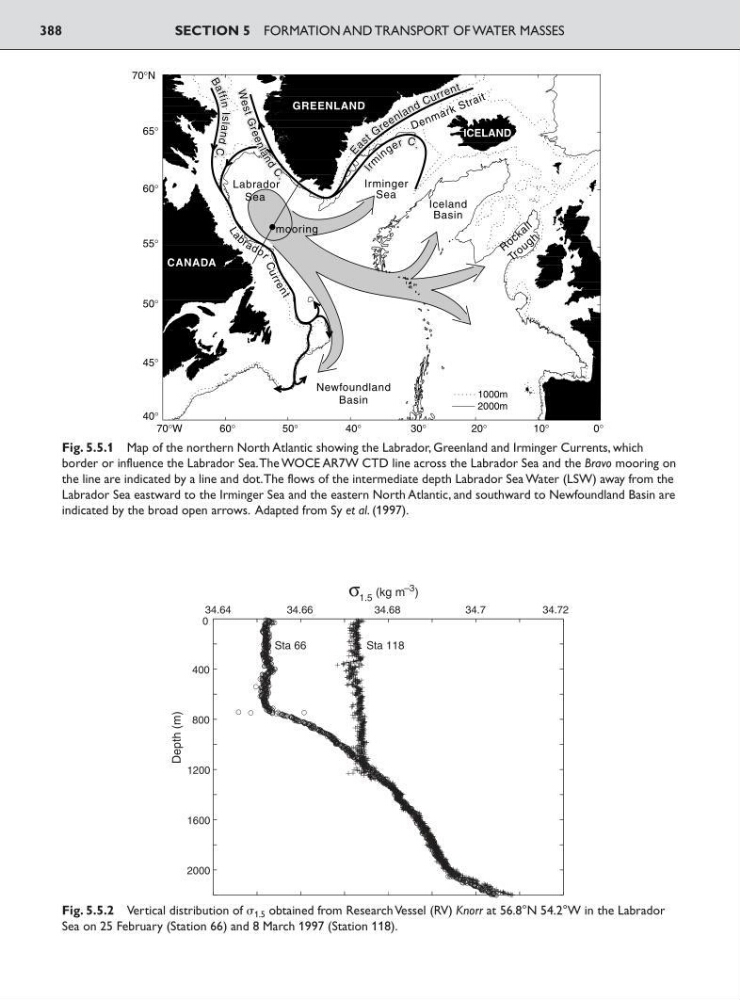
Fig. 5.5.1 Map of the northern North Atlantic showing the Labrador, Greenland and Irminger Currents, which
border or influence the Labrador Sea.The WOCE AR7W CTD line across the Labrador Sea and the Bravo mooring on
the line are indicated by a line and dot.The flows of the intermediate depth Labrador Sea Water (LSW) away from the
Labrador Sea eastward to the Irminger Sea and the eastern North Atlantic, and southward to Newfoundland Basin are
indicated by the broad open arrows. Adapted from Sy et al. (1997).
34.64
34.66
34.68
34.7
34.72
2000
1600
1200
800
400
0
Depth (m)
Sta 66
Sta 118
σ (kg m )
1.5
–3
Fig. 5.5.2 Vertical distribution of 1.5 obtained from Research Vessel (RV) Knorr at 56.8°N 54.2°W in the Labrador
Sea on 25 February (Station 66) and 8 March 1997 (Station 118).
388
W W W e e e s s s t t t G G G r r r e e e e e e n n n l l la a a n n n d d d
C C C
. . .
C A ND A
CANADA
G R E E N LA N D
GREENLAND
E E E
a a a s s s t t t G G G r r r e e e e e e n n n l l l a a a n n n d d d C C C u u u r r r r r r e e e n n n t t t
B B B a a a f f ff f fi i in n n I I Is s sl
l la
a an
n nd
d d
C C C
. . .
I I I r r r
m
i n g e e e r r r C C C
. . .
L
a
b r a d o
r
C
u
r
r
e
n
t
L
ICELAND
1000m
2000m
Sea
Labrador
mooring
Irminger
Sea
D e n m a r k S t r a it
Iceland
Basin
R
o c k a l l
T r o u g h
Newfoundland
Basin
70°N
65°
60°
60°
55°
50°
50°
45°
40°
40°
70°W
3 0 °
20°
10°
0 °
Fig. 5.5.1 Map of the northern North Atlantic showing the Labrador, Greenland and Irminger Currents, which
border or influence the Labrador Sea.The WOCE AR7W CTD line across the Labrador Sea and the Bravo mooring on
the line are indicated by a line and dot.The flows of the intermediate depth Labrador Sea Water (LSW) away from the
Labrador Sea eastward to the Irminger Sea and the eastern North Atlantic, and southward to Newfoundland Basin are
indicated by the broad open arrows. Adapted from Sy et al. (1997).
34.64
34.66
34.68
34.7
34.72
2000
1600
1200
800
400
0
Depth (m)
Sta 66
Sta 118
σ (kg m )
1.5
–3
Fig. 5.5.2 Vertical distribution of 1.5 obtained from Research Vessel (RV) Knorr at 56.8°N 54.2°W in the Labrador
Sea on 25 February (Station 66) and 8 March 1997 (Station 118).