

some to question the Osborn–Cox and Osborn
interpretation of ocean observations (e.g. Gibson,
1982; Baker and Gibson, 1987). But, as discussed
below, recent microstructure studies that sampled
the abyssal ocean found significant mixing there.
Moreover, weak diapycnal mixing at thermocline
depth in the ocean interior was confirmed during
the WOCE programme by Ledwell et al.’s (1993,
1998) North Atlantic Tracer Release Experiment.
NATRE focused on diapycnal dispersion across
a density surface at about 300 m depth in the
eastern subtropical Atlantic, an environment
characterized by a near-climatological (see below)
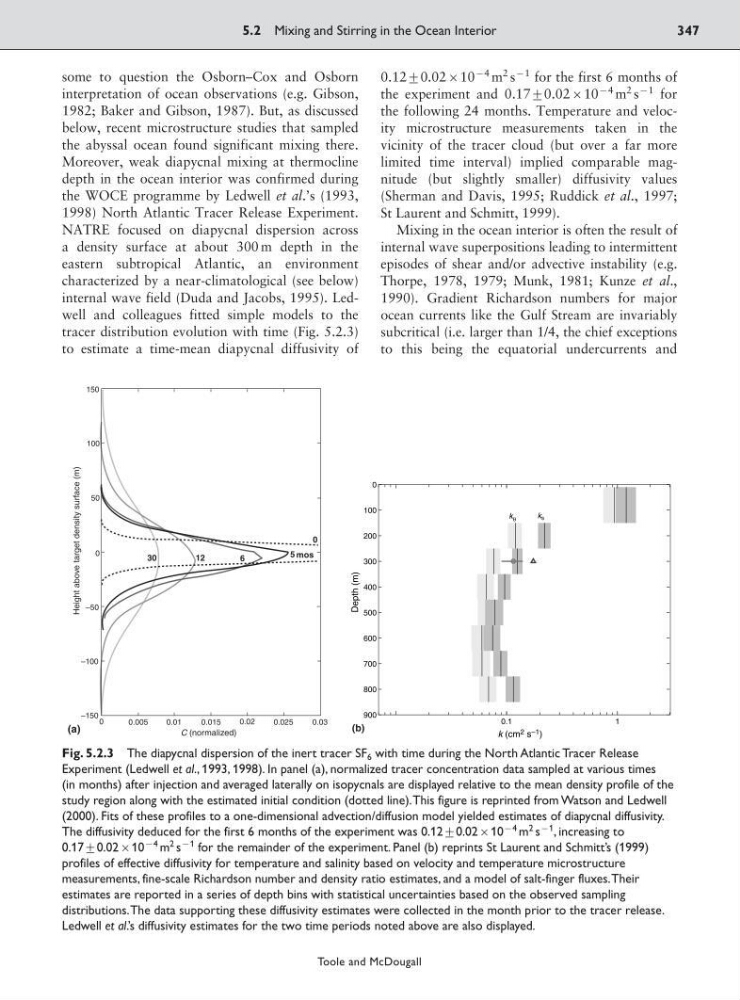
internal wave field (Duda and Jacobs, 1995). Ledwell and colleagues fitted simple models to the
tracer distribution evolution with time (Fig. 5.2.3)
to estimate a time-mean diapycnal diffusivity of
0.12<0.0210
94 m
2 s
91 for the first 6 months of
the experiment and 0.17<0.0210
94 m
2 s
91 for
the following 24 months. Temperature and velocity microstructure measurements taken in the
vicinity of the tracer cloud (but over a far more
limited time interval) implied comparable magnitude (but slightly smaller) diffusivity values
(Sherman and Davis, 1995; Ruddick et al., 1997;
St Laurent and Schmitt, 1999).
Mixing in the ocean interior is often the result of
internal wave superpositions leading to intermittent
episodes of shear and/or advective instability (e.g.
Thorpe, 1978, 1979; Munk, 1981; Kunze et al.,
1990). Gradient Richardson numbers for major
ocean currents like the Gulf Stream are invariably
subcritical (i.e. larger than 1/4, the chief exceptions
to this being the equatorial undercurrents and
5.2 Mixing and Stirring in the Ocean Interior
347
Toole and McDougall
150
100
–100
–150
50
–50
0
Height above target density surface (m)
30
12
6
5 mos
0
0
0.005
0.01
0.015
0.02
0.025
0.03
C (normalized)
(a)
0.1
1
0
100
200
300
400
500
600
700
800
900
k θ
k s
k (cm 2 s –1 )
Depth (m)
(b)
Fig. 5.2.3 The diapycnal dispersion of the inert tracer SF 6 with time during the North Atlantic Tracer Release
Experiment (Ledwell et al., 1993, 1998). In panel (a), normalized tracer concentration data sampled at various times
(in months) after injection and averaged laterally on isopycnals are displayed relative to the mean density profile of the
study region along with the estimated initial condition (dotted line).This figure is reprinted from Watson and Ledwell
(2000). Fits of these profiles to a one-dimensional advection/diffusion model yielded estimates of diapycnal diffusivity.
The diffusivity deduced for the first 6 months of the experiment was 0.12<0.0210
94 m
2 s
91 , increasing to
0.17<0.0210
94 m
2 s
91 for the remainder of the experiment. Panel (b) reprints St Laurent and Schmitt’s (1999)
profiles of effective diffusivity for temperature and salinity based on velocity and temperature microstructure
measurements, fine-scale Richardson number and density ratio estimates, and a model of salt-finger fluxes.Their
estimates are reported in a series of depth bins with statistical uncertainties based on the observed sampling
distributions.The data supporting these diffusivity estimates were collected in the month prior to the tracer release.
Ledwell et al.’s diffusivity estimates for the two time periods noted above are also displayed.
interpretation of ocean observations (e.g. Gibson,
1982; Baker and Gibson, 1987). But, as discussed
below, recent microstructure studies that sampled
the abyssal ocean found significant mixing there.
Moreover, weak diapycnal mixing at thermocline
depth in the ocean interior was confirmed during
the WOCE programme by Ledwell et al.’s (1993,
1998) North Atlantic Tracer Release Experiment.
NATRE focused on diapycnal dispersion across
a density surface at about 300 m depth in the
eastern subtropical Atlantic, an environment
characterized by a near-climatological (see below)
internal wave field (Duda and Jacobs, 1995). Ledwell and colleagues fitted simple models to the
tracer distribution evolution with time (Fig. 5.2.3)
to estimate a time-mean diapycnal diffusivity of
0.12<0.0210
94 m
2 s
91 for the first 6 months of
the experiment and 0.17<0.0210
94 m
2 s
91 for
the following 24 months. Temperature and velocity microstructure measurements taken in the
vicinity of the tracer cloud (but over a far more
limited time interval) implied comparable magnitude (but slightly smaller) diffusivity values
(Sherman and Davis, 1995; Ruddick et al., 1997;
St Laurent and Schmitt, 1999).
Mixing in the ocean interior is often the result of
internal wave superpositions leading to intermittent
episodes of shear and/or advective instability (e.g.
Thorpe, 1978, 1979; Munk, 1981; Kunze et al.,
1990). Gradient Richardson numbers for major
ocean currents like the Gulf Stream are invariably
subcritical (i.e. larger than 1/4, the chief exceptions
to this being the equatorial undercurrents and
5.2 Mixing and Stirring in the Ocean Interior
347
Toole and McDougall
150
100
–100
–150
50
–50
0
Height above target density surface (m)
30
12
6
5 mos
0
0
0.005
0.01
0.015
0.02
0.025
0.03
C (normalized)
(a)
0.1
1
0
100
200
300
400
500
600
700
800
900
k θ
k s
k (cm 2 s –1 )
Depth (m)
(b)
Fig. 5.2.3 The diapycnal dispersion of the inert tracer SF 6 with time during the North Atlantic Tracer Release
Experiment (Ledwell et al., 1993, 1998). In panel (a), normalized tracer concentration data sampled at various times
(in months) after injection and averaged laterally on isopycnals are displayed relative to the mean density profile of the
study region along with the estimated initial condition (dotted line).This figure is reprinted from Watson and Ledwell
(2000). Fits of these profiles to a one-dimensional advection/diffusion model yielded estimates of diapycnal diffusivity.
The diffusivity deduced for the first 6 months of the experiment was 0.12<0.0210
94 m
2 s
91 , increasing to
0.17<0.0210
94 m
2 s
91 for the remainder of the experiment. Panel (b) reprints St Laurent and Schmitt’s (1999)
profiles of effective diffusivity for temperature and salinity based on velocity and temperature microstructure
measurements, fine-scale Richardson number and density ratio estimates, and a model of salt-finger fluxes.Their
estimates are reported in a series of depth bins with statistical uncertainties based on the observed sampling
distributions.The data supporting these diffusivity estimates were collected in the month prior to the tracer release.
Ledwell et al.’s diffusivity estimates for the two time periods noted above are also displayed.