

5.1 Ocean Surface Water Mass Transformation
333
Large and Nurser
15
15
10
10
5
5
5
0
0
–5
–5
–5
Sv
Sv
Sv
Sv
Sv
Sv
Sv
20
20
0
0
0
0
–20
–20
–40
–40
–60
–60
–10
–10
–10
–10
–15
10
10
15
–20
–30
20
22
24
26
28
30
20
22
24
26
28
30
4
2
0
–2
–4
–6
–8
(a) Atlantic north of 42.5°N
(d) Pacific north of 42.5°N
(f) S. Ocean south of 42.5°S
(b) Atlantic 30°- 42.5°N
(e) Pacific 30°- 42.5°N
(g) S. Ocean 30°- 42.5°S
(c) Pacific 10°S - 10°N
Total
Thermal
Haline
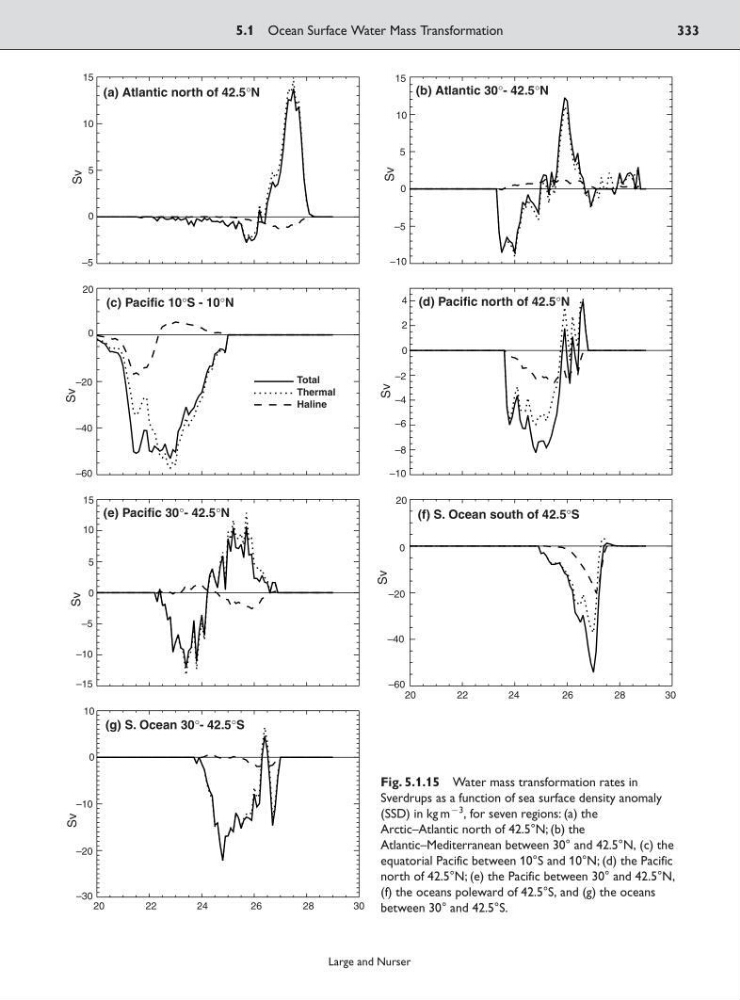
Fig. 5.1.15 Water mass transformation rates in
Sverdrups as a function of sea surface density anomaly
(SSD) in kg m
93
, for seven regions: (a) the
Arctic–Atlantic north of 42.5°N; (b) the
Atlantic–Mediterranean between 30° and 42.5°N, (c) the
equatorial Pacific between 10°S and 10°N; (d) the Pacific
north of 42.5°N; (e) the Pacific between 30° and 42.5°N,
(f) the oceans poleward of 42.5°S, and (g) the oceans
between 30° and 42.5°S.
333
Large and Nurser
15
15
10
10
5
5
5
0
0
–5
–5
–5
Sv
Sv
Sv
Sv
Sv
Sv
Sv
20
20
0
0
0
0
–20
–20
–40
–40
–60
–60
–10
–10
–10
–10
–15
10
10
15
–20
–30
20
22
24
26
28
30
20
22
24
26
28
30
4
2
0
–2
–4
–6
–8
(a) Atlantic north of 42.5°N
(d) Pacific north of 42.5°N
(f) S. Ocean south of 42.5°S
(b) Atlantic 30°- 42.5°N
(e) Pacific 30°- 42.5°N
(g) S. Ocean 30°- 42.5°S
(c) Pacific 10°S - 10°N
Total
Thermal
Haline
Fig. 5.1.15 Water mass transformation rates in
Sverdrups as a function of sea surface density anomaly
(SSD) in kg m
93
, for seven regions: (a) the
Arctic–Atlantic north of 42.5°N; (b) the
Atlantic–Mediterranean between 30° and 42.5°N, (c) the
equatorial Pacific between 10°S and 10°N; (d) the Pacific
north of 42.5°N; (e) the Pacific between 30° and 42.5°N,
(f) the oceans poleward of 42.5°S, and (g) the oceans
between 30° and 42.5°S.