

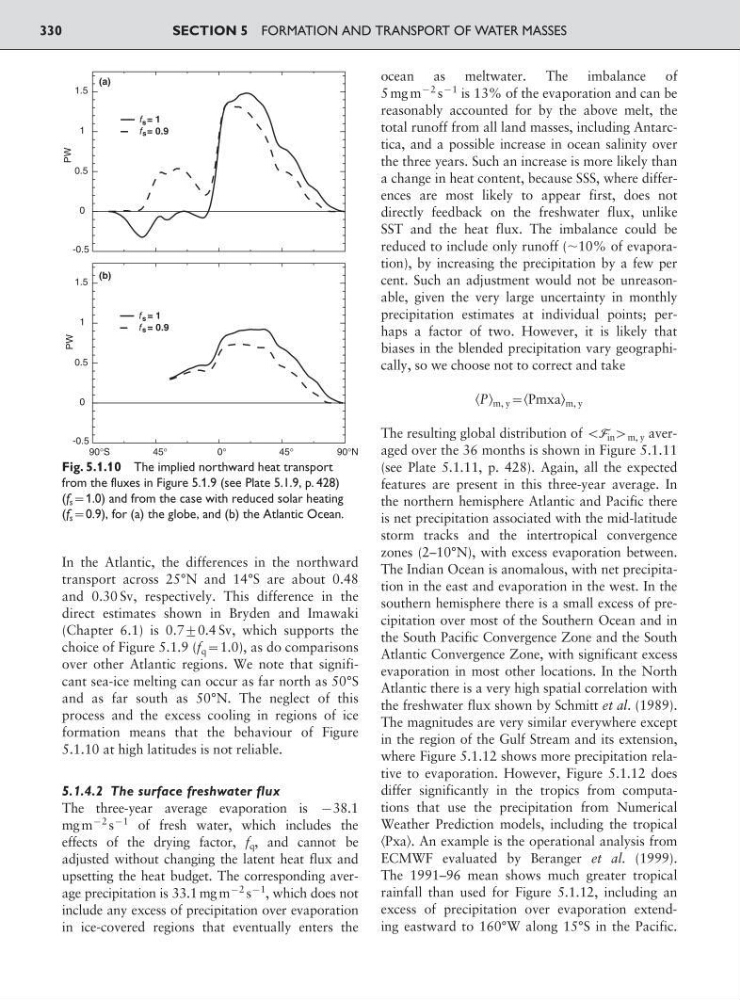
In the Atlantic, the differences in the northward
transport across 25°N and 14°S are about 0.48
and 0.30 Sv, respectively. This difference in the
direct estimates shown in Bryden and Imawaki
(Chapter 6.1) is 0.7<0.4 Sv, which supports the
choice of Figure 5.1.9 (f q :1.0), as do comparisons
over other Atlantic regions. We note that significant sea-ice melting can occur as far north as 50°S
and as far south as 50°N. The neglect of this
process and the excess cooling in regions of ice
formation means that the behaviour of Figure
5.1.10 at high latitudes is not reliable.
5.1.4.2 The surface freshwater flux
The three-year average evaporation is 938.1
mg m
92 s
91 of fresh water, which includes the
effects of the drying factor, f q , and cannot be
adjusted without changing the latent heat flux and
upsetting the heat budget. The corresponding average precipitation is 33.1 mg m
92 s
91
, which does not
include any excess of precipitation over evaporation
in ice-covered regions that eventually enters the
ocean as meltwater. The imbalance of
5 mg m
92 s
91 is 13% of the evaporation and can be
reasonably accounted for by the above melt, the
total runoff from all land masses, including Antarctica, and a possible increase in ocean salinity over
the three years. Such an increase is more likely than
a change in heat content, because SSS, where differences are most likely to appear first, does not
directly feedback on the freshwater flux, unlike
SST and the heat flux. The imbalance could be
reduced to include only runoff (ϳ10% of evaporation), by increasing the precipitation by a few per
cent. Such an adjustment would not be unreasonable, given the very large uncertainty in monthly
precipitation estimates at individual points; perhaps a factor of two. However, it is likely that
biases in the blended precipitation vary geographically, so we choose not to correct and take
͗P͘ m, y :͗Pmxa͘ m, y
The resulting global distribution of :F in 9 m, y averaged over the 36 months is shown in Figure 5.1.11
(see Plate 5.1.11, p. 428). Again, all the expected
features are present in this three-year average. In
the northern hemisphere Atlantic and Pacific there
is net precipitation associated with the mid-latitude
storm tracks and the intertropical convergence
zones (2–10°N), with excess evaporation between.
The Indian Ocean is anomalous, with net precipitation in the east and evaporation in the west. In the
southern hemisphere there is a small excess of precipitation over most of the Southern Ocean and in
the South Pacific Convergence Zone and the South
Atlantic Convergence Zone, with significant excess
evaporation in most other locations. In the North
Atlantic there is a very high spatial correlation with
the freshwater flux shown by Schmitt et al. (1989).
The magnitudes are very similar everywhere except
in the region of the Gulf Stream and its extension,
where Figure 5.1.12 shows more precipitation relative to evaporation. However, Figure 5.1.12 does
differ significantly in the tropics from computations that use the precipitation from Numerical
Weather Prediction models, including the tropical
͗Pxa͘. An example is the operational analysis from
ECMWF evaluated by Beranger et al. (1999).
The 1991–96 mean shows much greater tropical
rainfall than used for Figure 5.1.12, including an
excess of precipitation over evaporation extending eastward to 160°W along 15°S in the Pacific.
SECTION 5 FORMATION AND TRANSPORT OF WATER MASSES
330
1.5
1
0.5
0
-0.5
1.5
1
0.5
0
-0.5
f = 1
f = 0.9
s
s
s
s
f = 1
f = 0.9
(a)
(b)
90°S
4 5 °
0 °
45°
90°N
PW
PW
Fig. 5.1.10 The implied northward heat transport
from the fluxes in Figure 5.1.9 (see Plate 5.1.9, p. 428)
(f s :1.0) and from the case with reduced solar heating
(f s :0.9), for (a) the globe, and (b) the Atlantic Ocean.
transport across 25°N and 14°S are about 0.48
and 0.30 Sv, respectively. This difference in the
direct estimates shown in Bryden and Imawaki
(Chapter 6.1) is 0.7<0.4 Sv, which supports the
choice of Figure 5.1.9 (f q :1.0), as do comparisons
over other Atlantic regions. We note that significant sea-ice melting can occur as far north as 50°S
and as far south as 50°N. The neglect of this
process and the excess cooling in regions of ice
formation means that the behaviour of Figure
5.1.10 at high latitudes is not reliable.
5.1.4.2 The surface freshwater flux
The three-year average evaporation is 938.1
mg m
92 s
91 of fresh water, which includes the
effects of the drying factor, f q , and cannot be
adjusted without changing the latent heat flux and
upsetting the heat budget. The corresponding average precipitation is 33.1 mg m
92 s
91
, which does not
include any excess of precipitation over evaporation
in ice-covered regions that eventually enters the
ocean as meltwater. The imbalance of
5 mg m
92 s
91 is 13% of the evaporation and can be
reasonably accounted for by the above melt, the
total runoff from all land masses, including Antarctica, and a possible increase in ocean salinity over
the three years. Such an increase is more likely than
a change in heat content, because SSS, where differences are most likely to appear first, does not
directly feedback on the freshwater flux, unlike
SST and the heat flux. The imbalance could be
reduced to include only runoff (ϳ10% of evaporation), by increasing the precipitation by a few per
cent. Such an adjustment would not be unreasonable, given the very large uncertainty in monthly
precipitation estimates at individual points; perhaps a factor of two. However, it is likely that
biases in the blended precipitation vary geographically, so we choose not to correct and take
͗P͘ m, y :͗Pmxa͘ m, y
The resulting global distribution of :F in 9 m, y averaged over the 36 months is shown in Figure 5.1.11
(see Plate 5.1.11, p. 428). Again, all the expected
features are present in this three-year average. In
the northern hemisphere Atlantic and Pacific there
is net precipitation associated with the mid-latitude
storm tracks and the intertropical convergence
zones (2–10°N), with excess evaporation between.
The Indian Ocean is anomalous, with net precipitation in the east and evaporation in the west. In the
southern hemisphere there is a small excess of precipitation over most of the Southern Ocean and in
the South Pacific Convergence Zone and the South
Atlantic Convergence Zone, with significant excess
evaporation in most other locations. In the North
Atlantic there is a very high spatial correlation with
the freshwater flux shown by Schmitt et al. (1989).
The magnitudes are very similar everywhere except
in the region of the Gulf Stream and its extension,
where Figure 5.1.12 shows more precipitation relative to evaporation. However, Figure 5.1.12 does
differ significantly in the tropics from computations that use the precipitation from Numerical
Weather Prediction models, including the tropical
͗Pxa͘. An example is the operational analysis from
ECMWF evaluated by Beranger et al. (1999).
The 1991–96 mean shows much greater tropical
rainfall than used for Figure 5.1.12, including an
excess of precipitation over evaporation extending eastward to 160°W along 15°S in the Pacific.
SECTION 5 FORMATION AND TRANSPORT OF WATER MASSES
330
1.5
1
0.5
0
-0.5
1.5
1
0.5
0
-0.5
f = 1
f = 0.9
s
s
s
s
f = 1
f = 0.9
(a)
(b)
90°S
4 5 °
0 °
45°
90°N
PW
PW
Fig. 5.1.10 The implied northward heat transport
from the fluxes in Figure 5.1.9 (see Plate 5.1.9, p. 428)
(f s :1.0) and from the case with reduced solar heating
(f s :0.9), for (a) the globe, and (b) the Atlantic Ocean.