

southward again in November–January; some
appears to get right across the equator in a narrow
western boundary current. By February–April,
saline water has penetrated southward to the equator at a wide range of longitudes. Oxygen at the
middle level ( :26.6; not shown) shows a similar
seasonal pattern, with smaller amplitude, perhaps
due to slower seasonally reversing currents at this
depth; so also does the salinity at :27.2.
From these sources, and numerous previous
observations (Swallow and Bruce, 1966; Warren
et al., 1966; Düing and Schott, 1978; Leetmaa
et al., 1982; Quadfasel and Schott, 1982, 1983;
Gonella et al., 1983; Schott, 1983, 1986; Swallow
et al., 1983, 1991; Molinari et al., 1990a) SSF
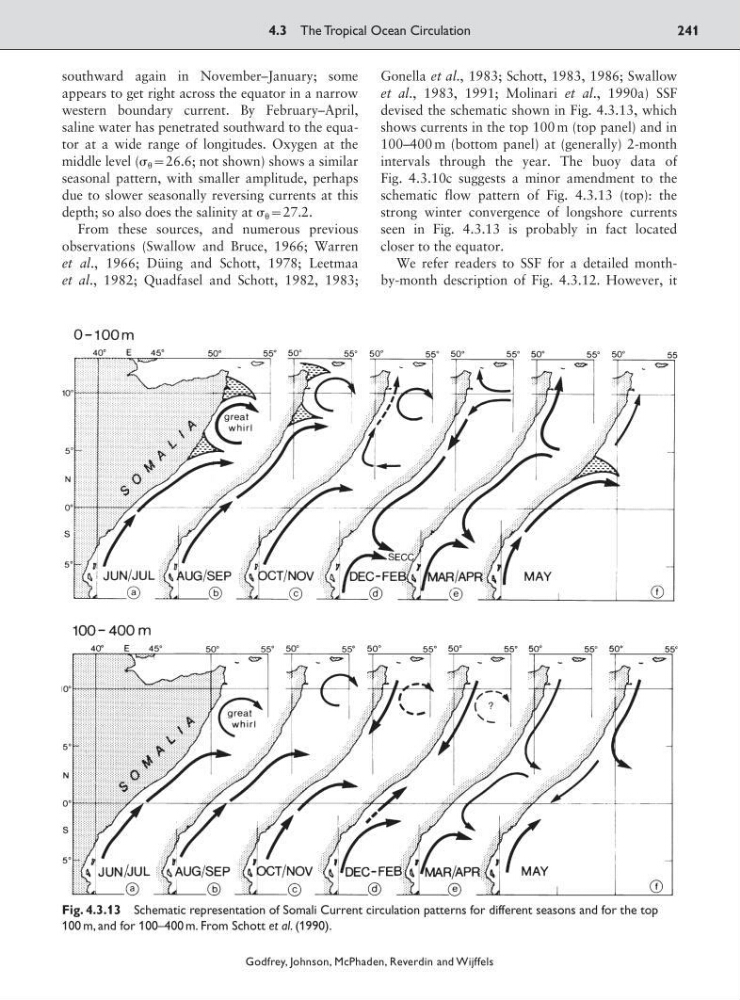
devised the schematic shown in Fig. 4.3.13, which
shows currents in the top 100 m (top panel) and in
100–400 m (bottom panel) at (generally) 2-month
intervals through the year. The buoy data of
Fig. 4.3.10c suggests a minor amendment to the
schematic flow pattern of Fig. 4.3.13 (top): the
strong winter convergence of longshore currents
seen in Fig. 4.3.13 is probably in fact located
closer to the equator.
We refer readers to SSF for a detailed monthby-month description of Fig. 4.3.12. However, it
4.3 The Tropical Ocean Circulation
241
Godfrey, Johnson, McPhaden, Reverdin and Wijffels
Fig. 4.3.13 Schematic representation of Somali Current circulation patterns for different seasons and for the top
100 m, and for 100–400 m. From Schott et al. (1990).
appears to get right across the equator in a narrow
western boundary current. By February–April,
saline water has penetrated southward to the equator at a wide range of longitudes. Oxygen at the
middle level ( :26.6; not shown) shows a similar
seasonal pattern, with smaller amplitude, perhaps
due to slower seasonally reversing currents at this
depth; so also does the salinity at :27.2.
From these sources, and numerous previous
observations (Swallow and Bruce, 1966; Warren
et al., 1966; Düing and Schott, 1978; Leetmaa
et al., 1982; Quadfasel and Schott, 1982, 1983;
Gonella et al., 1983; Schott, 1983, 1986; Swallow
et al., 1983, 1991; Molinari et al., 1990a) SSF
devised the schematic shown in Fig. 4.3.13, which
shows currents in the top 100 m (top panel) and in
100–400 m (bottom panel) at (generally) 2-month
intervals through the year. The buoy data of
Fig. 4.3.10c suggests a minor amendment to the
schematic flow pattern of Fig. 4.3.13 (top): the
strong winter convergence of longshore currents
seen in Fig. 4.3.13 is probably in fact located
closer to the equator.
We refer readers to SSF for a detailed monthby-month description of Fig. 4.3.12. However, it
4.3 The Tropical Ocean Circulation
241
Godfrey, Johnson, McPhaden, Reverdin and Wijffels
Fig. 4.3.13 Schematic representation of Somali Current circulation patterns for different seasons and for the top
100 m, and for 100–400 m. From Schott et al. (1990).