

to 4°S, but must exit eastward. Indeed, as suggested by Fig. 4.3.10c, much of the annual mean
eastward flow along the interior equatorial Indian
Ocean appears to originate from the western
boundary; the convergence in Fig. 4.3.10c occurs
in autumn and winter. In winter, water approaching the equator from the Somali Current has an
SST of 26–27°C, while SST elsewhere is more than
28°C; so some of the flow from the northeast may
sink to join the eastward EUC. This may either
happen directly, or by crossing the equator in the
top 100 m of the western boundary current and
joining the EUC shortly afterwards. If this hypothesis is correct, the details of the SCS will probably
need to be accurately represented in models, in
order to quantify the meridional and zonal transfers of heat in the tropical Indian Ocean. We will
therefore describe the SCS in a little detail.
SSF developed the first schematic, observationbased picture of the mean seasonal flow pattern of
the SCS. They first examined 2 years of current
meter records at several equatorial moorings, plus
earlier off-equatorial current meter records. These
records are very different from one another.
Equatorial longshore current profiles show much
stronger vertical shears than those near 5°N and
4°S in both monsoons, and profiles for the winter
monsoon change sign between 4°S and 5°N,
suggesting strong longshore convergence onto the
equatorial region at this time (in agreement with
Fig. 4.3.10c). Further, while surface currents
reverse with the monsoon winds at the equator,
the equatorial longshore flow is northward below
about 100 m throughout the year, except in
March–April.
Second, SSF combine available hydrographic
data to display 3-monthly seasonal patterns of
salinity at :25 (near a salinity maximum, 110 m
on equator); of oxygen at :26.6 (an oxygen
minimum, 250 m on equator); and at :27.2
(Red Sea salinity maximum, 680 m on equator).
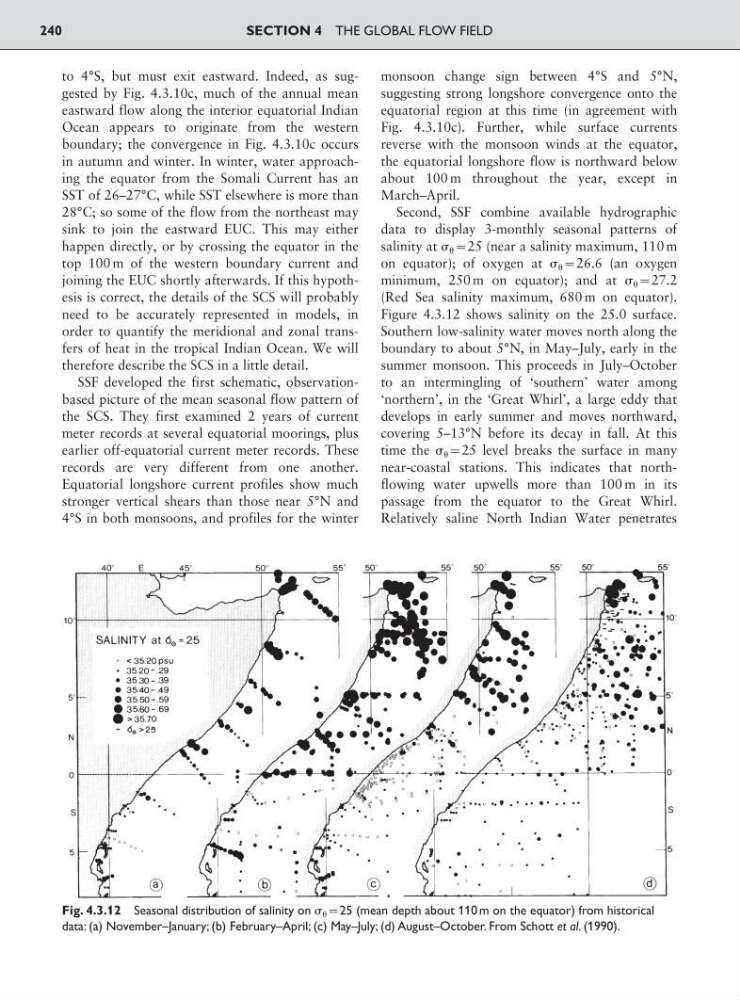
Figure 4.3.12 shows salinity on the 25.0 surface.
Southern low-salinity water moves north along the
boundary to about 5°N, in May–July, early in the
summer monsoon. This proceeds in July–October
to an intermingling of ‘southern’ water among
‘northern’, in the ‘Great Whirl’, a large eddy that
develops in early summer and moves northward,
covering 5–13°N before its decay in fall. At this
time the :25 level breaks the surface in many
near-coastal stations. This indicates that northflowing water upwells more than 100 m in its
passage from the equator to the Great Whirl.
Relatively saline North Indian Water penetrates
SECTION 4 THE GLOBAL FLOW FIELD
240
Fig. 4.3.12 Seasonal distribution of salinity on :25 (mean depth about 110 m on the equator) from historical
data: (a) November–January; (b) February–April; (c) May–July; (d) August–October. From Schott et al. (1990).
eastward flow along the interior equatorial Indian
Ocean appears to originate from the western
boundary; the convergence in Fig. 4.3.10c occurs
in autumn and winter. In winter, water approaching the equator from the Somali Current has an
SST of 26–27°C, while SST elsewhere is more than
28°C; so some of the flow from the northeast may
sink to join the eastward EUC. This may either
happen directly, or by crossing the equator in the
top 100 m of the western boundary current and
joining the EUC shortly afterwards. If this hypothesis is correct, the details of the SCS will probably
need to be accurately represented in models, in
order to quantify the meridional and zonal transfers of heat in the tropical Indian Ocean. We will
therefore describe the SCS in a little detail.
SSF developed the first schematic, observationbased picture of the mean seasonal flow pattern of
the SCS. They first examined 2 years of current
meter records at several equatorial moorings, plus
earlier off-equatorial current meter records. These
records are very different from one another.
Equatorial longshore current profiles show much
stronger vertical shears than those near 5°N and
4°S in both monsoons, and profiles for the winter
monsoon change sign between 4°S and 5°N,
suggesting strong longshore convergence onto the
equatorial region at this time (in agreement with
Fig. 4.3.10c). Further, while surface currents
reverse with the monsoon winds at the equator,
the equatorial longshore flow is northward below
about 100 m throughout the year, except in
March–April.
Second, SSF combine available hydrographic
data to display 3-monthly seasonal patterns of
salinity at :25 (near a salinity maximum, 110 m
on equator); of oxygen at :26.6 (an oxygen
minimum, 250 m on equator); and at :27.2
(Red Sea salinity maximum, 680 m on equator).
Figure 4.3.12 shows salinity on the 25.0 surface.
Southern low-salinity water moves north along the
boundary to about 5°N, in May–July, early in the
summer monsoon. This proceeds in July–October
to an intermingling of ‘southern’ water among
‘northern’, in the ‘Great Whirl’, a large eddy that
develops in early summer and moves northward,
covering 5–13°N before its decay in fall. At this
time the :25 level breaks the surface in many
near-coastal stations. This indicates that northflowing water upwells more than 100 m in its
passage from the equator to the Great Whirl.
Relatively saline North Indian Water penetrates
SECTION 4 THE GLOBAL FLOW FIELD
240
Fig. 4.3.12 Seasonal distribution of salinity on :25 (mean depth about 110 m on the equator) from historical
data: (a) November–January; (b) February–April; (c) May–July; (d) August–October. From Schott et al. (1990).