

4.2.2.2 Developments during WOCE
During the WOCE period there have been two
important developments which can provide independent estimates of a reference current. The first
makes use of Global Positioning Systems (GPS)
ship navigation together with the Acoustic Doppler
Current Profiler (ADCP) (King et al., Chapter 3.1).
The second makes use of long-term statistics from
freely drifting surface floats and deep drifters
(Davis and Zenk, Chapter 3.2; Niiler, Chapter
4.1). Both methods are still under development,
with new techniques being developed to reduce the
errors involved.
In one example of the first method, Saunders
and King (1995b) used GPS and ADCP measurements, made when their ship was underway, to
estimate a reference velocity for each station pair in
the western boundary current region of the WOCE
A11 section. Taking a slightly different approach,
Beal and Bryden (1997) used GPS with a lowered
ADCP to estimate the reference velocity at each
station in their Agulhas Current section. In both
cases the estimated errors are a few centimetres per
second, so the method is not presently suitable in
the deep ocean outside the boundary current
region. However, in future it may be possible
to use the barotropic velocity measured from a
lowered ADCP to reduce the errors further (see
King et al., Chapter 3.1).
The float studies during WOCE have involved
the development and deployment of high-quality
surface floats and deep profiling floats (Davis,
1998b; Davis and Zenk, Chapter 3.2). The float
results for the flow of the Equatorial and South
Pacific at 900 m are shown in Fig. 3.2.6. Overall
there is good agreement with the analysis of Reid
(1989, 1994, 1997). Both types of floats may
be affected by the (random) noise due to the
mesoscale eddy field and more systematic errors
due to regions of convergence and divergence at
their measurement level.
As discussed by Hogg in Chapter 4.5, the
WOCE current meter arrays have also provided
excellent data on the transports in deep western
boundary currents and the flows between deep
ocean basins. However, away from these regions,
SECTION 4 THE GLOBAL FLOW FIELD
208
0
500
1000
1500
2000
2500
3000
3500
4000
4500
5000
5500
6000
Depth (m)
0
500
1000
1500
2000
2500 3000
3500
4000 4500
Distance (km)
-1 5
-10
-10
-5
-5
0
0
0
0
5
5
5
5
5
10
1 0
-4 -2 0 2
4
6
8 10 12 14 16 18 20 22 24 26 28 30
32
34
Latitude
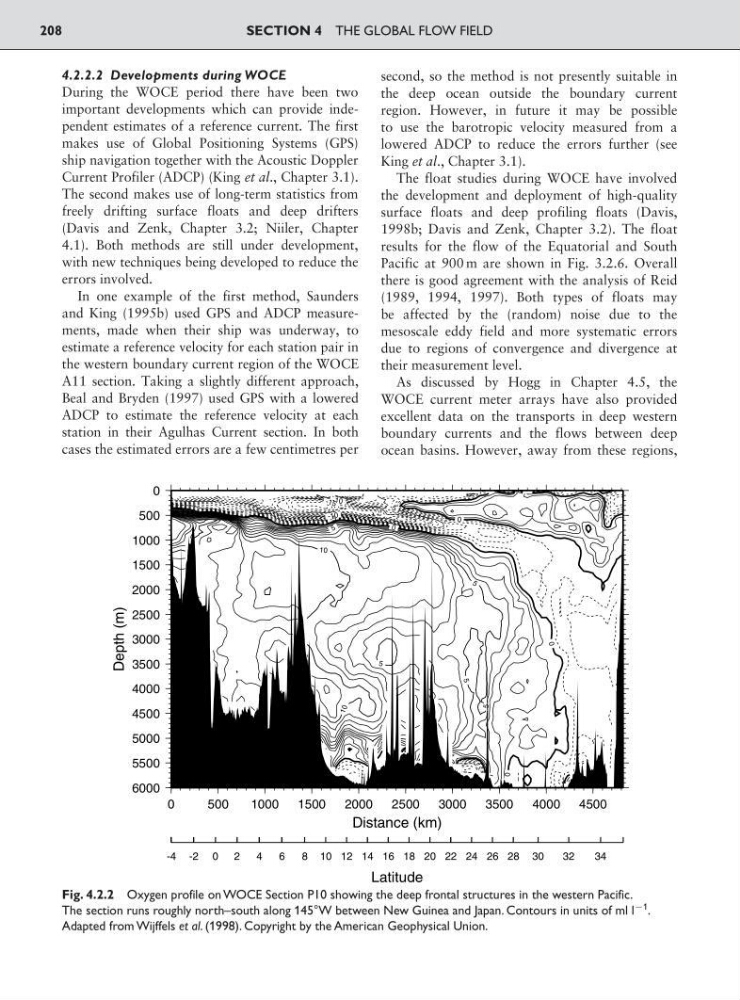
Fig. 4.2.2 Oxygen profile on WOCE Section P10 showing the deep frontal structures in the western Pacific.
The section runs roughly north–south along 145°W between New Guinea and Japan. Contours in units of ml l
91 .
Adapted from Wijffels et al. (1998). Copyright by the American Geophysical Union.
During the WOCE period there have been two
important developments which can provide independent estimates of a reference current. The first
makes use of Global Positioning Systems (GPS)
ship navigation together with the Acoustic Doppler
Current Profiler (ADCP) (King et al., Chapter 3.1).
The second makes use of long-term statistics from
freely drifting surface floats and deep drifters
(Davis and Zenk, Chapter 3.2; Niiler, Chapter
4.1). Both methods are still under development,
with new techniques being developed to reduce the
errors involved.
In one example of the first method, Saunders
and King (1995b) used GPS and ADCP measurements, made when their ship was underway, to
estimate a reference velocity for each station pair in
the western boundary current region of the WOCE
A11 section. Taking a slightly different approach,
Beal and Bryden (1997) used GPS with a lowered
ADCP to estimate the reference velocity at each
station in their Agulhas Current section. In both
cases the estimated errors are a few centimetres per
second, so the method is not presently suitable in
the deep ocean outside the boundary current
region. However, in future it may be possible
to use the barotropic velocity measured from a
lowered ADCP to reduce the errors further (see
King et al., Chapter 3.1).
The float studies during WOCE have involved
the development and deployment of high-quality
surface floats and deep profiling floats (Davis,
1998b; Davis and Zenk, Chapter 3.2). The float
results for the flow of the Equatorial and South
Pacific at 900 m are shown in Fig. 3.2.6. Overall
there is good agreement with the analysis of Reid
(1989, 1994, 1997). Both types of floats may
be affected by the (random) noise due to the
mesoscale eddy field and more systematic errors
due to regions of convergence and divergence at
their measurement level.
As discussed by Hogg in Chapter 4.5, the
WOCE current meter arrays have also provided
excellent data on the transports in deep western
boundary currents and the flows between deep
ocean basins. However, away from these regions,
SECTION 4 THE GLOBAL FLOW FIELD
208
0
500
1000
1500
2000
2500
3000
3500
4000
4500
5000
5500
6000
Depth (m)
0
500
1000
1500
2000
2500 3000
3500
4000 4500
Distance (km)
-1 5
-10
-10
-5
-5
0
0
0
0
5
5
5
5
5
10
1 0
-4 -2 0 2
4
6
8 10 12 14 16 18 20 22 24 26 28 30
32
34
Latitude
Fig. 4.2.2 Oxygen profile on WOCE Section P10 showing the deep frontal structures in the western Pacific.
The section runs roughly north–south along 145°W between New Guinea and Japan. Contours in units of ml l
91 .
Adapted from Wijffels et al. (1998). Copyright by the American Geophysical Union.