

we have :aK E T bc , where K E is the eddy kinetic
energy, T bc is an eddy-mixing time scale, and a is a
constant. Stammer (1998) showed that the T/Pderived eddy time scale (T alt ) is approximately
0.5 T bc , leading to :2aK E T alt . The constant a is a
correlation coefficient that determines the efficiency of individual eddies to mix tracer particles.
Based on the theory of Stone (1972), a:0.7
(L r /L)
2 , where L r is the Rossby radius of deformation of the first baroclinic mode and L an eddy
mixing length scale. Using T/P results, a ϳ0.05.
Another factor of 0.1 was further applied to a to
scale K E to represent the average kinetic energy of
the upper 1000 m, resulting in a:0.005. With this
value and the T/P results for K E and T alt , Stammer
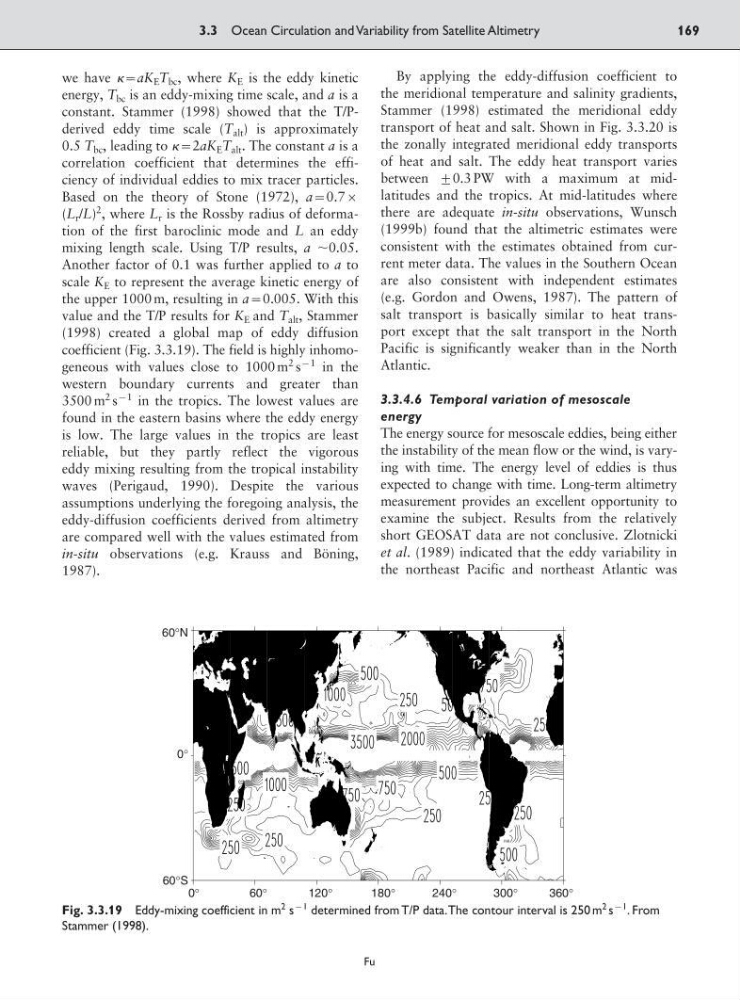
(1998) created a global map of eddy diffusion
coefficient (Fig. 3.3.19). The field is highly inhomogeneous with values close to 1000 m
2 s
91 in the
western boundary currents and greater than
3500 m
2 s
91 in the tropics. The lowest values are
found in the eastern basins where the eddy energy
is low. The large values in the tropics are least
reliable, but they partly reflect the vigorous
eddy mixing resulting from the tropical instability
waves (Perigaud, 1990). Despite the various
assumptions underlying the foregoing analysis, the
eddy-diffusion coefficients derived from altimetry
are compared well with the values estimated from
in-situ observations (e.g. Krauss and Böning,
1987).
By applying the eddy-diffusion coefficient to
the meridional temperature and salinity gradients,
Stammer (1998) estimated the meridional eddy
transport of heat and salt. Shown in Fig. 3.3.20 is
the zonally integrated meridional eddy transports
of heat and salt. The eddy heat transport varies
between <0.3 PW with a maximum at midlatitudes and the tropics. At mid-latitudes where
there are adequate in-situ observations, Wunsch
(1999b) found that the altimetric estimates were
consistent with the estimates obtained from current meter data. The values in the Southern Ocean
are also consistent with independent estimates
(e.g. Gordon and Owens, 1987). The pattern of
salt transport is basically similar to heat transport except that the salt transport in the North
Pacific is significantly weaker than in the North
Atlantic.
3.3.4.6 Temporal variation of mesoscale
energy
The energy source for mesoscale eddies, being either
the instability of the mean flow or the wind, is varying with time. The energy level of eddies is thus
expected to change with time. Long-term altimetry
measurement provides an excellent opportunity to
examine the subject. Results from the relatively
short GEOSAT data are not conclusive. Zlotnicki
et al. (1989) indicated that the eddy variability in
the northeast Pacific and northeast Atlantic was
3.3 Ocean Circulation and Variability from Satellite Altimetry
169
Fu
60°N
0°
60°S
0°
60°
120°
180°
240°
300°
360°
Fig. 3.3.19 Eddy-mixing coefficient in m
2 s
91 determined from T/P data.The contour interval is 250 m
2 s
91
. From
Stammer (1998).
energy, T bc is an eddy-mixing time scale, and a is a
constant. Stammer (1998) showed that the T/Pderived eddy time scale (T alt ) is approximately
0.5 T bc , leading to :2aK E T alt . The constant a is a
correlation coefficient that determines the efficiency of individual eddies to mix tracer particles.
Based on the theory of Stone (1972), a:0.7
(L r /L)
2 , where L r is the Rossby radius of deformation of the first baroclinic mode and L an eddy
mixing length scale. Using T/P results, a ϳ0.05.
Another factor of 0.1 was further applied to a to
scale K E to represent the average kinetic energy of
the upper 1000 m, resulting in a:0.005. With this
value and the T/P results for K E and T alt , Stammer
(1998) created a global map of eddy diffusion
coefficient (Fig. 3.3.19). The field is highly inhomogeneous with values close to 1000 m
2 s
91 in the
western boundary currents and greater than
3500 m
2 s
91 in the tropics. The lowest values are
found in the eastern basins where the eddy energy
is low. The large values in the tropics are least
reliable, but they partly reflect the vigorous
eddy mixing resulting from the tropical instability
waves (Perigaud, 1990). Despite the various
assumptions underlying the foregoing analysis, the
eddy-diffusion coefficients derived from altimetry
are compared well with the values estimated from
in-situ observations (e.g. Krauss and Böning,
1987).
By applying the eddy-diffusion coefficient to
the meridional temperature and salinity gradients,
Stammer (1998) estimated the meridional eddy
transport of heat and salt. Shown in Fig. 3.3.20 is
the zonally integrated meridional eddy transports
of heat and salt. The eddy heat transport varies
between <0.3 PW with a maximum at midlatitudes and the tropics. At mid-latitudes where
there are adequate in-situ observations, Wunsch
(1999b) found that the altimetric estimates were
consistent with the estimates obtained from current meter data. The values in the Southern Ocean
are also consistent with independent estimates
(e.g. Gordon and Owens, 1987). The pattern of
salt transport is basically similar to heat transport except that the salt transport in the North
Pacific is significantly weaker than in the North
Atlantic.
3.3.4.6 Temporal variation of mesoscale
energy
The energy source for mesoscale eddies, being either
the instability of the mean flow or the wind, is varying with time. The energy level of eddies is thus
expected to change with time. Long-term altimetry
measurement provides an excellent opportunity to
examine the subject. Results from the relatively
short GEOSAT data are not conclusive. Zlotnicki
et al. (1989) indicated that the eddy variability in
the northeast Pacific and northeast Atlantic was
3.3 Ocean Circulation and Variability from Satellite Altimetry
169
Fu
60°N
0°
60°S
0°
60°
120°
180°
240°
300°
360°
Fig. 3.3.19 Eddy-mixing coefficient in m
2 s
91 determined from T/P data.The contour interval is 250 m
2 s
91
. From
Stammer (1998).