

at wavelengths shorter than 60 km in the large
expanse of extremely low data variance is entirely
due to noise. He then showed that the eddy kinetic
energy at high latitudes (e.g. the Labrador Sea) was
dominated by scales less than 60 km. His results
also indicated that the distribution of energy with
scales as small as 20 km was still correlated with
oceanic structures instead of being spatially homogeneous as expected for measurement noise.
The kinetic energy of the surface geostrophic current estimated from T/P by Stammer (1997b) was
compared with a global set of sparsely populated
current meter observations (Wunsch, 1997). There
is a general agreement between the two estimates.
Based on the current meter observations, Wunsch
(1997) found that the eddy kinetic energy is mostly
dominated by the barotropic and first baroclinic
modes. Because the baroclinic mode is intensified
near the surface, the altimeter observations reflect
primarily the baroclinic mode, and thus the motion
of the main thermocline.
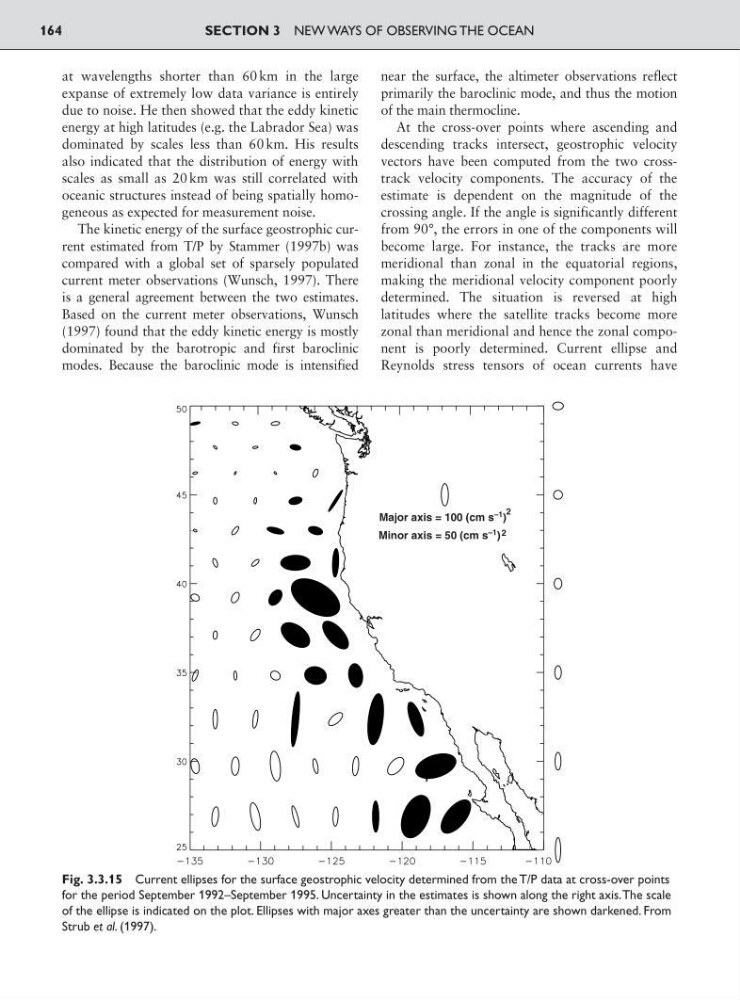
At the cross-over points where ascending and
descending tracks intersect, geostrophic velocity
vectors have been computed from the two crosstrack velocity components. The accuracy of the
estimate is dependent on the magnitude of the
crossing angle. If the angle is significantly different
from 90°, the errors in one of the components will
become large. For instance, the tracks are more
meridional than zonal in the equatorial regions,
making the meridional velocity component poorly
determined. The situation is reversed at high
latitudes where the satellite tracks become more
zonal than meridional and hence the zonal component is poorly determined. Current ellipse and
Reynolds stress tensors of ocean currents have
SECTION 3 NEW WAYS OF OBSERVING THE OCEAN
164
Major axis = 100 (cm s
–1 )
Minor axis = 50 (cm s –1 )
2
2
Fig. 3.3.15 Current ellipses for the surface geostrophic velocity determined from the T/P data at cross-over points
for the period September 1992–September 1995. Uncertainty in the estimates is shown along the right axis.The scale
of the ellipse is indicated on the plot. Ellipses with major axes greater than the uncertainty are shown darkened. From
Strub et al. (1997).
expanse of extremely low data variance is entirely
due to noise. He then showed that the eddy kinetic
energy at high latitudes (e.g. the Labrador Sea) was
dominated by scales less than 60 km. His results
also indicated that the distribution of energy with
scales as small as 20 km was still correlated with
oceanic structures instead of being spatially homogeneous as expected for measurement noise.
The kinetic energy of the surface geostrophic current estimated from T/P by Stammer (1997b) was
compared with a global set of sparsely populated
current meter observations (Wunsch, 1997). There
is a general agreement between the two estimates.
Based on the current meter observations, Wunsch
(1997) found that the eddy kinetic energy is mostly
dominated by the barotropic and first baroclinic
modes. Because the baroclinic mode is intensified
near the surface, the altimeter observations reflect
primarily the baroclinic mode, and thus the motion
of the main thermocline.
At the cross-over points where ascending and
descending tracks intersect, geostrophic velocity
vectors have been computed from the two crosstrack velocity components. The accuracy of the
estimate is dependent on the magnitude of the
crossing angle. If the angle is significantly different
from 90°, the errors in one of the components will
become large. For instance, the tracks are more
meridional than zonal in the equatorial regions,
making the meridional velocity component poorly
determined. The situation is reversed at high
latitudes where the satellite tracks become more
zonal than meridional and hence the zonal component is poorly determined. Current ellipse and
Reynolds stress tensors of ocean currents have
SECTION 3 NEW WAYS OF OBSERVING THE OCEAN
164
Major axis = 100 (cm s
–1 )
Minor axis = 50 (cm s –1 )
2
2
Fig. 3.3.15 Current ellipses for the surface geostrophic velocity determined from the T/P data at cross-over points
for the period September 1992–September 1995. Uncertainty in the estimates is shown along the right axis.The scale
of the ellipse is indicated on the plot. Ellipses with major axes greater than the uncertainty are shown darkened. From
Strub et al. (1997).