

of the South Atlantic Ocean. These waves are
marginally resolved by T/P. At periods longer than
60 days, Vivier et al. (1999) showed that a timedependent Sverdrup relation, represented by equation (3.3.5) without the first term on the right-hand
side, was valid in most of the subtropical and subpolar regions of the Pacific Ocean. They filtered
out all propagating waves from altimeter data
before the analysis.
Large-scale variability in the T/P data at periods
less than 100 days was investigated by Fu and
Smith (1996) and Chao and Fu (1995) using ocean
general circulation models. Geographic distribution of sea-level variance in the period band of
20–100 days is in excellent agreement between
model and data (Fig. 3.3.5, see Plate 3.3.5, p. 172).
Most of the variance is in the high latitudes and
the tropics. While the variance in the tropics is
mostly due to baroclinic motion (Fukumori et al.,
1998), the variance at the high latitudes is caused
by barotropic motion, as suggested by the high
degree of coherence between the model-simulated
sea level and barotropic stream function in the
period band at high latitudes (Chao and Fu, 1995).
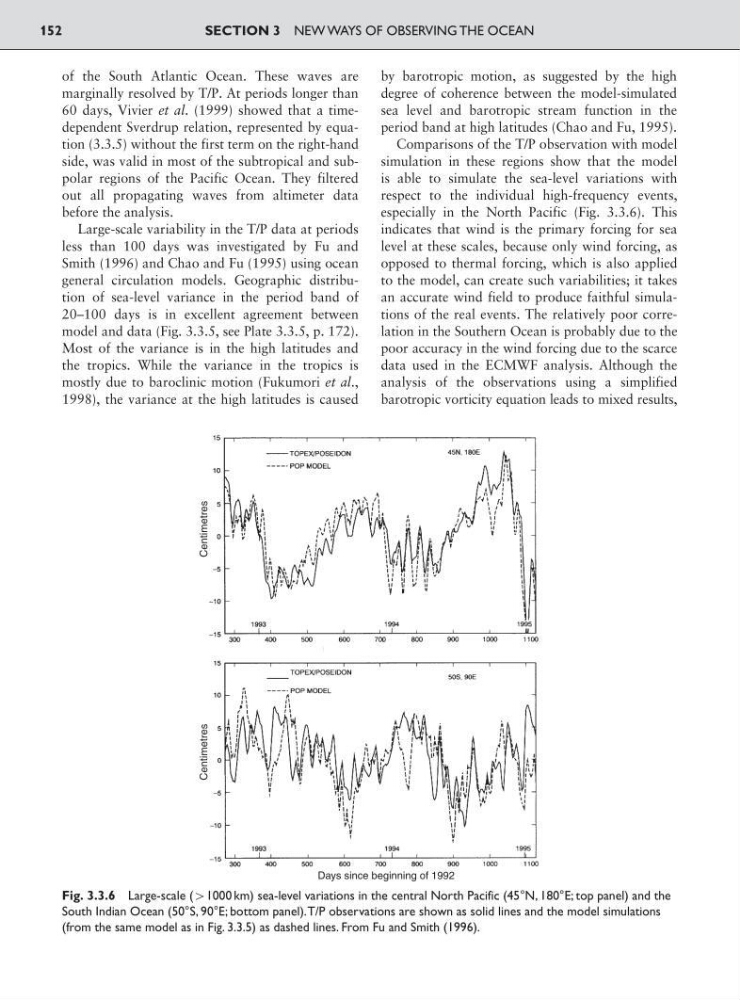
Comparisons of the T/P observation with model
simulation in these regions show that the model
is able to simulate the sea-level variations with
respect to the individual high-frequency events,
especially in the North Pacific (Fig. 3.3.6). This
indicates that wind is the primary forcing for sea
level at these scales, because only wind forcing, as
opposed to thermal forcing, which is also applied
to the model, can create such variabilities; it takes
an accurate wind field to produce faithful simulations of the real events. The relatively poor correlation in the Southern Ocean is probably due to the
poor accuracy in the wind forcing due to the scarce
data used in the ECMWF analysis. Although the
analysis of the observations using a simplified
barotropic vorticity equation leads to mixed results,
SECTION 3 NEW WAYS OF OBSERVING THE OCEAN
152
Centimetres
Centimetres
Days since beginning of 1992
Fig. 3.3.6 Large-scale (91000 km) sea-level variations in the central North Pacific (45°N, 180°E; top panel) and the
South Indian Ocean (50°S, 90°E; bottom panel).T/P observations are shown as solid lines and the model simulations
(from the same model as in Fig. 3.3.5) as dashed lines. From Fu and Smith (1996).
marginally resolved by T/P. At periods longer than
60 days, Vivier et al. (1999) showed that a timedependent Sverdrup relation, represented by equation (3.3.5) without the first term on the right-hand
side, was valid in most of the subtropical and subpolar regions of the Pacific Ocean. They filtered
out all propagating waves from altimeter data
before the analysis.
Large-scale variability in the T/P data at periods
less than 100 days was investigated by Fu and
Smith (1996) and Chao and Fu (1995) using ocean
general circulation models. Geographic distribution of sea-level variance in the period band of
20–100 days is in excellent agreement between
model and data (Fig. 3.3.5, see Plate 3.3.5, p. 172).
Most of the variance is in the high latitudes and
the tropics. While the variance in the tropics is
mostly due to baroclinic motion (Fukumori et al.,
1998), the variance at the high latitudes is caused
by barotropic motion, as suggested by the high
degree of coherence between the model-simulated
sea level and barotropic stream function in the
period band at high latitudes (Chao and Fu, 1995).
Comparisons of the T/P observation with model
simulation in these regions show that the model
is able to simulate the sea-level variations with
respect to the individual high-frequency events,
especially in the North Pacific (Fig. 3.3.6). This
indicates that wind is the primary forcing for sea
level at these scales, because only wind forcing, as
opposed to thermal forcing, which is also applied
to the model, can create such variabilities; it takes
an accurate wind field to produce faithful simulations of the real events. The relatively poor correlation in the Southern Ocean is probably due to the
poor accuracy in the wind forcing due to the scarce
data used in the ECMWF analysis. Although the
analysis of the observations using a simplified
barotropic vorticity equation leads to mixed results,
SECTION 3 NEW WAYS OF OBSERVING THE OCEAN
152
Centimetres
Centimetres
Days since beginning of 1992
Fig. 3.3.6 Large-scale (91000 km) sea-level variations in the central North Pacific (45°N, 180°E; top panel) and the
South Indian Ocean (50°S, 90°E; bottom panel).T/P observations are shown as solid lines and the model simulations
(from the same model as in Fig. 3.3.5) as dashed lines. From Fu and Smith (1996).