

of Australia and New Zealand) found with floats
but not by Reid, and in the absence in the float
data of the tropical gyre found by Reid. While
analysis of the South Pacific must await the complete data set, and the integration with basin-wide
hydrographic data is yet to begin, Wijffels et al.
(2000) have used an inverse analysis to infer
absolute velocity across the P6 section near 32°S
from hydrographic and float data. They found the
float data to significantly improve their analysis
over what could be obtained from hydrographic
data alone.
The North Pacific was not sampled as completely as the South Pacific but Riser (personal
communication) explored mid-depth flow in the
western North Pacific using 57 RAFOS floats
deployed at 1000 m roughly between 20°N and
40°N and west of the dateline. Except near the
western boundary, the motion of these floats is
remarkably zonal, much more so than comparable large-area deployments in other subtropical
regions. The ratio of eddy variability to large-scale
signal is also smaller than is generally found at
these latitudes in other basins. The large-scale flow
is eastward everywhere outside the boundary
region and, unlike schemes derived from hydrography, there is no westward return flow in the
region. Flow over the Izu-Ogasawara Ridge, in
both the large-scale field and individual trajectories, is normal to bathymetric contours, showing
that barotropic potential vorticity is far from conserved. The Emperor Seamounts do, however,
appear to steer the flow.
In 1994 and 1995 the WHP turned to the Indian
Ocean and these cruises supported basin-wide
deployments of over 225 ALACE floats. Over
half of these were temperature profilers deployed
mainly in the tropics, where seasonal thermal variability is poorly known, and in subpolar latitudes
where even the mean thermal structure had been
poorly sampled. Most of these floats are still
reporting and no basin-scale analysis has yet been
completed.
Float coverage in the South Atlantic has been
through a number of loosely coordinated regional
studies including substantial deployments in the
SECTION 3 NEW WAYS OF OBSERVING THE OCEAN
132
20°N
0°
20°
40°
60°S
150°E
200°
250°
300°
Pressure in
cm of water
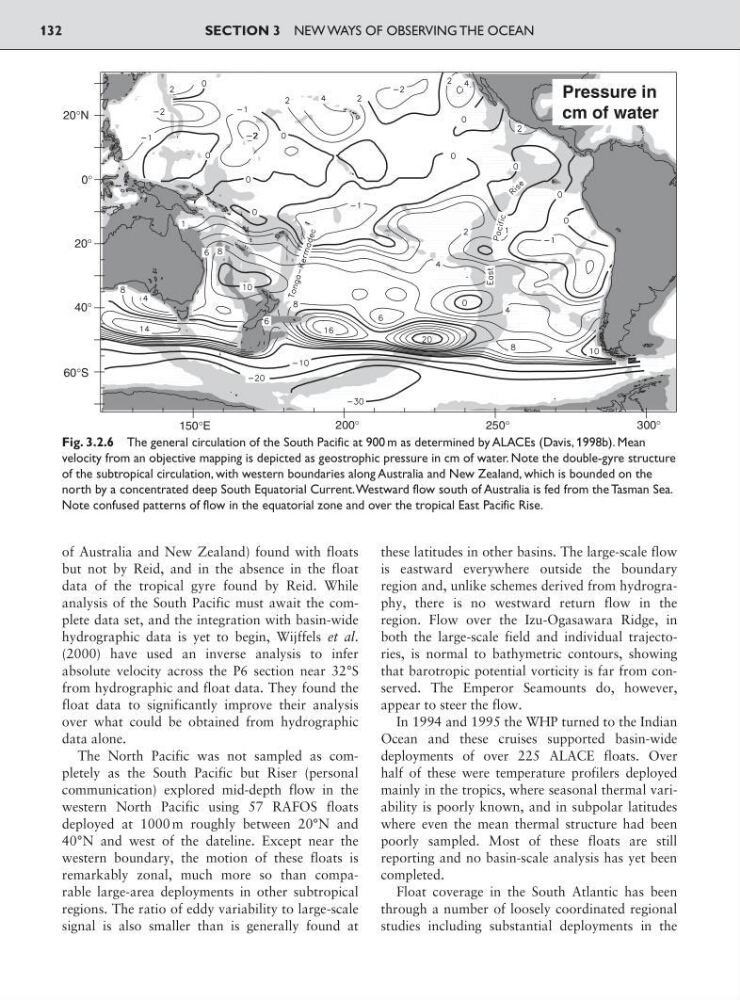
Fig. 3.2.6 The general circulation of the South Pacific at 900 m as determined by ALACEs (Davis, 1998b). Mean
velocity from an objective mapping is depicted as geostrophic pressure in cm of water. Note the double-gyre structure
of the subtropical circulation, with western boundaries along Australia and New Zealand, which is bounded on the
north by a concentrated deep South Equatorial Current.Westward flow south of Australia is fed from the Tasman Sea.
Note confused patterns of flow in the equatorial zone and over the tropical East Pacific Rise.
but not by Reid, and in the absence in the float
data of the tropical gyre found by Reid. While
analysis of the South Pacific must await the complete data set, and the integration with basin-wide
hydrographic data is yet to begin, Wijffels et al.
(2000) have used an inverse analysis to infer
absolute velocity across the P6 section near 32°S
from hydrographic and float data. They found the
float data to significantly improve their analysis
over what could be obtained from hydrographic
data alone.
The North Pacific was not sampled as completely as the South Pacific but Riser (personal
communication) explored mid-depth flow in the
western North Pacific using 57 RAFOS floats
deployed at 1000 m roughly between 20°N and
40°N and west of the dateline. Except near the
western boundary, the motion of these floats is
remarkably zonal, much more so than comparable large-area deployments in other subtropical
regions. The ratio of eddy variability to large-scale
signal is also smaller than is generally found at
these latitudes in other basins. The large-scale flow
is eastward everywhere outside the boundary
region and, unlike schemes derived from hydrography, there is no westward return flow in the
region. Flow over the Izu-Ogasawara Ridge, in
both the large-scale field and individual trajectories, is normal to bathymetric contours, showing
that barotropic potential vorticity is far from conserved. The Emperor Seamounts do, however,
appear to steer the flow.
In 1994 and 1995 the WHP turned to the Indian
Ocean and these cruises supported basin-wide
deployments of over 225 ALACE floats. Over
half of these were temperature profilers deployed
mainly in the tropics, where seasonal thermal variability is poorly known, and in subpolar latitudes
where even the mean thermal structure had been
poorly sampled. Most of these floats are still
reporting and no basin-scale analysis has yet been
completed.
Float coverage in the South Atlantic has been
through a number of loosely coordinated regional
studies including substantial deployments in the
SECTION 3 NEW WAYS OF OBSERVING THE OCEAN
132
20°N
0°
20°
40°
60°S
150°E
200°
250°
300°
Pressure in
cm of water
Fig. 3.2.6 The general circulation of the South Pacific at 900 m as determined by ALACEs (Davis, 1998b). Mean
velocity from an objective mapping is depicted as geostrophic pressure in cm of water. Note the double-gyre structure
of the subtropical circulation, with western boundaries along Australia and New Zealand, which is bounded on the
north by a concentrated deep South Equatorial Current.Westward flow south of Australia is fed from the Tasman Sea.
Note confused patterns of flow in the equatorial zone and over the tropical East Pacific Rise.